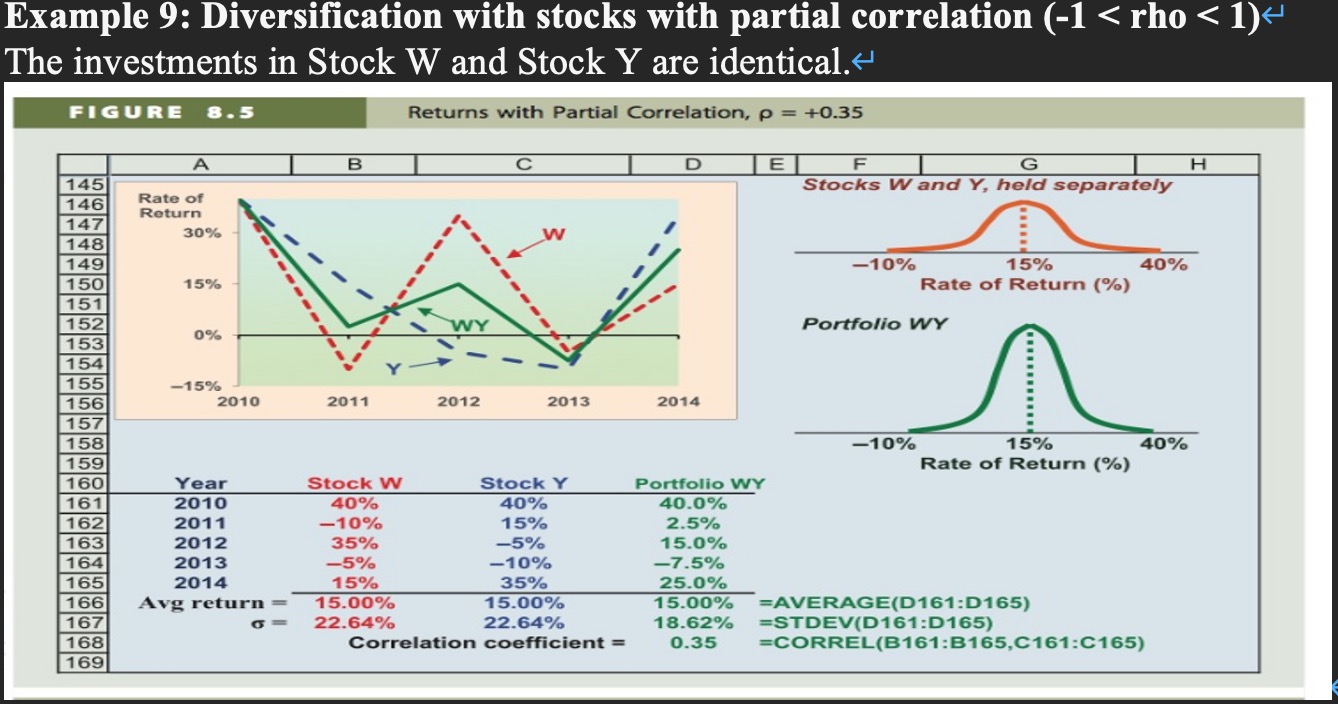
Since the sample size is very small, (only 5 years), n-1 should be used instead of n to get an unbiased estimator for the variance.
Since the sample size is very small, (only 5 years), "n-1" should be used instead of "n" to get an unbiased estimator for the variance.
Calculate the portfolio return in each year, and the expected rate of return and standard deviation for stocks w, y and portfolio wy. (We invest 50% in Stock W.)

Example 9: Diversification with stocks with partial correlation (-1 < rho < 1) < The investments in Stock W and Stock Y are identical. < FIGURE 8.5 Returns with Partial Correlation, p = +0.35 A B E F 145 146 G Stocks W and Y, held separately Rate of Return 147 30% 148 149 -10% 15% 40% 150 15% Rate of Return (%) 151 152 WY Portfolio WY 0% 153 154 155 -15% 156 2010 2011 2012 2013 2014 157 158 -10% 15% 40% 159 Rate of Return (%) 160 Year 161 2010 162 2011 Stock W 40% -10% Stock Y Portfolio WY 40% 40.0% 15% 2.5% 163 2012 35% -5% 15.0% 164 2013 -5% -10% -7.5% 165 2014 15% 35% 25.0% 166 Avg return= 15.00% 15.00% 15.00% 167 22.64% 22.64% =AVERAGE(D161:D165) 18.62% =STDEV(D161:D165) 168 Correlation coefficient = 0.35 =CORREL(B161:B165,C161:C165) 169 H
Step by Step Solution
There are 3 Steps involved in it
Step: 1

See step-by-step solutions with expert insights and AI powered tools for academic success
Step: 2

Step: 3

Ace Your Homework with AI
Get the answers you need in no time with our AI-driven, step-by-step assistance
Get Started


