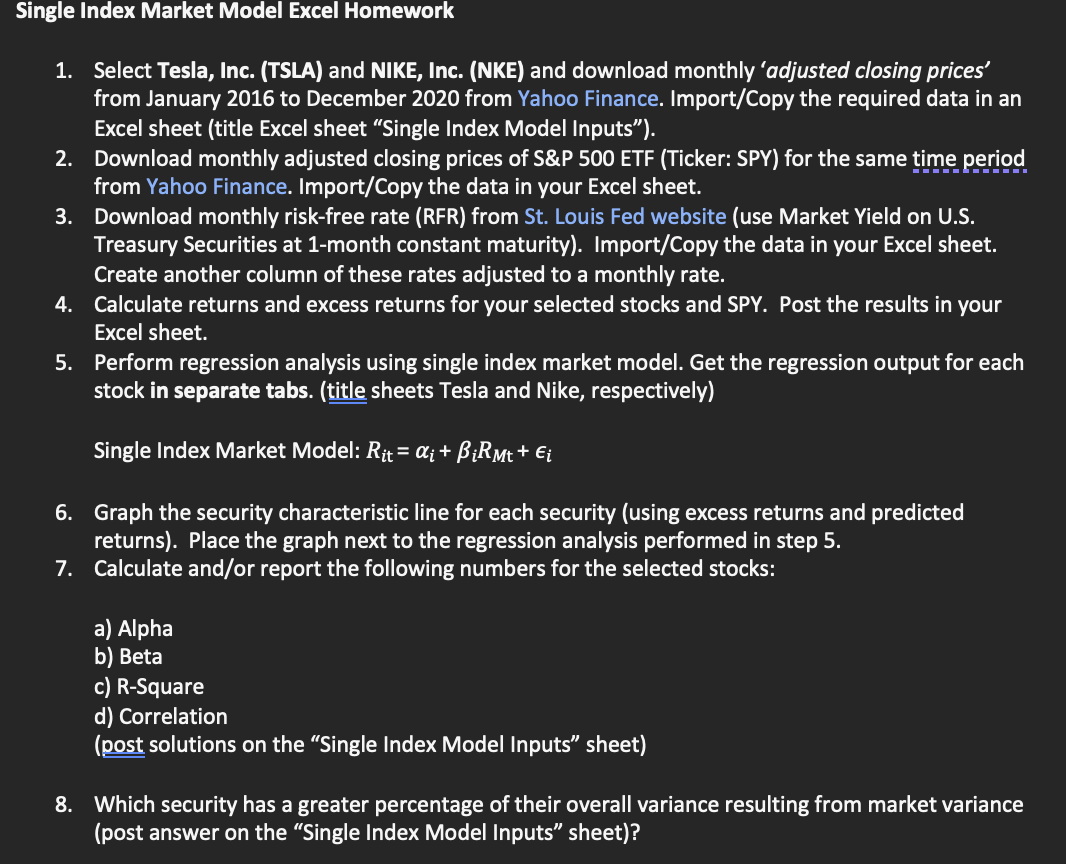
Single Index Market Model Excel Homework 1. Select Tesla, Inc. (TSLA) and NIKE, Inc. (NKE) and download monthly adjusted closing prices from January 2016 to December 2020 from Yahoo Finance. Import/Copy the required data in an Excel sheet (title Excel sheet Single Index Model Inputs). 2. Download monthly adjusted closing prices of S&P 500 ETF (Ticker: SPY) for the same time period from Yahoo Finance. Import/Copy the data in your Excel sheet. 3. Download monthly risk-free rate (RFR) from St. Louis Fed website (use Market Yield on U.S. Treasury Securities at 1-month constant maturity). Import/Copy the data in your Excel sheet. Create another column of these rates adjusted to a monthly rate. 4. Calculate returns and excess returns for your selected stocks and SPY. Post the results in your Excel sheet. 5. Perform regression analysis using single index market model. Get the regression output for each stock in separate tabs. (title sheets Tesla and Nike, respectively) Single Index Market Model: Rit = Q+ BiRmt + Ei 6. Graph the security characteristic line for each security (using excess returns and predicted returns). Place the graph next to the regression analysis performed in step 5. 7. Calculate and/or report the following numbers for the selected stocks: a) Alpha b) Beta c) R-Square d) Correlation (post solutions on the Single Index Model Inputs sheet) 8. Which security has a greater percentage of their overall variance resulting from market variance (post answer on the "Single Index Model Inputs sheet)? Single Index Market Model Excel Homework 1. Select Tesla, Inc. (TSLA) and NIKE, Inc. (NKE) and download monthly adjusted closing prices from January 2016 to December 2020 from Yahoo Finance. Import/Copy the required data in an Excel sheet (title Excel sheet Single Index Model Inputs). 2. Download monthly adjusted closing prices of S&P 500 ETF (Ticker: SPY) for the same time period from Yahoo Finance. Import/Copy the data in your Excel sheet. 3. Download monthly risk-free rate (RFR) from St. Louis Fed website (use Market Yield on U.S. Treasury Securities at 1-month constant maturity). Import/Copy the data in your Excel sheet. Create another column of these rates adjusted to a monthly rate. 4. Calculate returns and excess returns for your selected stocks and SPY. Post the results in your Excel sheet. 5. Perform regression analysis using single index market model. Get the regression output for each stock in separate tabs. (title sheets Tesla and Nike, respectively) Single Index Market Model: Rit = Q+ BiRmt + Ei 6. Graph the security characteristic line for each security (using excess returns and predicted returns). Place the graph next to the regression analysis performed in step 5. 7. Calculate and/or report the following numbers for the selected stocks: a) Alpha b) Beta c) R-Square d) Correlation (post solutions on the Single Index Model Inputs sheet) 8. Which security has a greater percentage of their overall variance resulting from market variance (post answer on the "Single Index Model Inputs sheet)


