Sir i am stuck for this question link for 6 https://math.usu.edu/~schneit/Statlets/StandardDeviation/sd.html ok You will use the following data set to answer all part of the
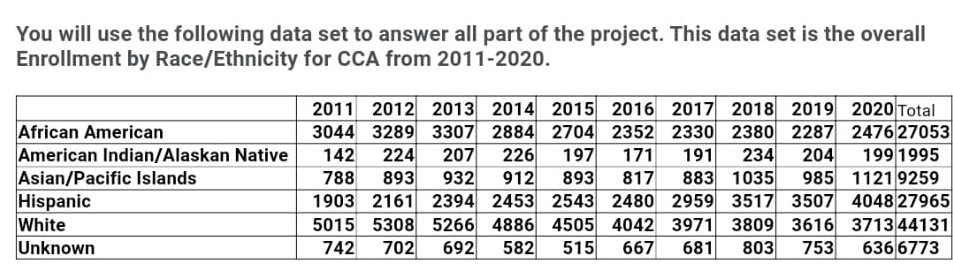
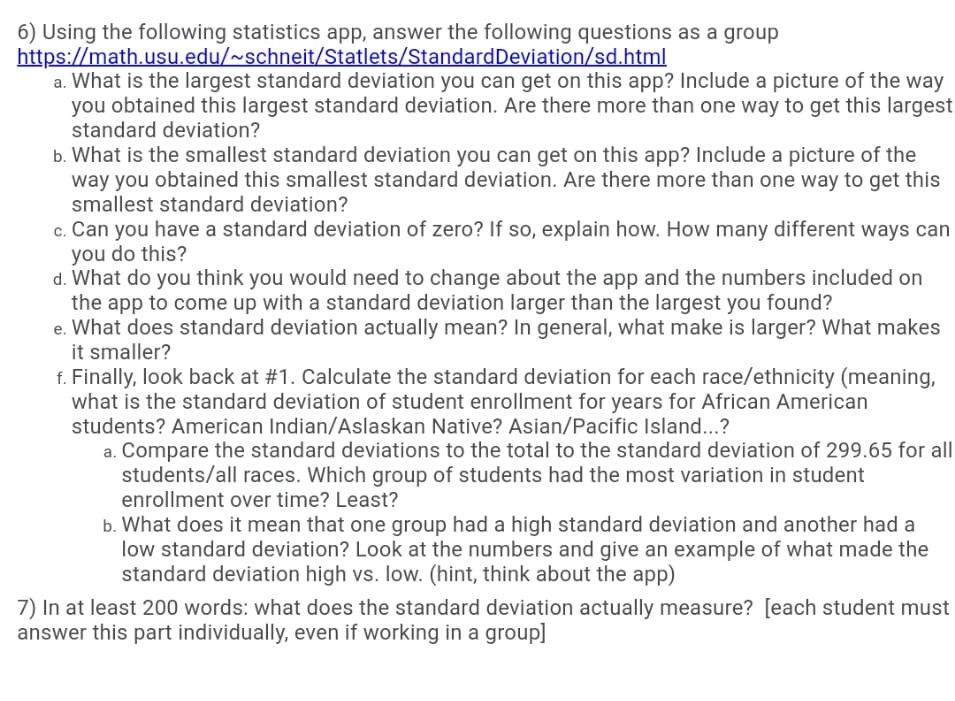
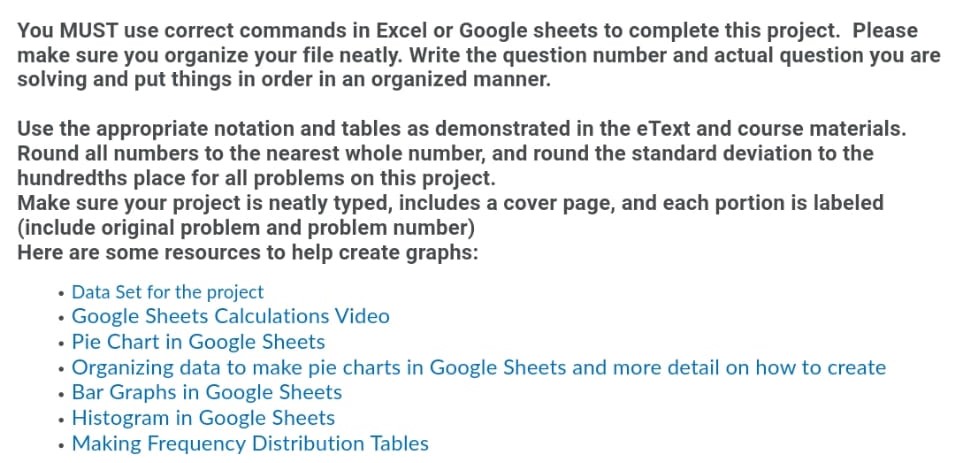
You will use the following data set to answer all part of the project. This data set is the overall Enrollment by Race/Ethnicity for CCA from 2011-2020. 2011 2012 2013 2014 2015 2016 2017 2018 2019 2020 Total African American 3044 3289 3307 2884 2704 2352 2330 2380 2287 2476 27053 American Indian/Alaskan Native 142 224 207 226 197 171 191 234 204 199 1995 Asian/Pacific Islands 788 893 932 912 893 817 883 1035 985 1121 9259 Hispanic 1903 2161 2394 2453 2543 2480 2959 3517 3507 4048 27965 White 5015 5308 5266 4886 4505 4042 3971 3809 3616 3713 44131 Unknown 742 702 692 582 515 667 681 803 753 636 67736) Using the following statistics app, answer the following questions as a group mmmmmmmmmmmmm a. What is the largest standard deviation you can get on this app? include a picture of the way you obtained this largest standard deviation. Are there more than one way to get this largest standard deviation? b. What is the smallest standard deviation you can get on this app? Include a picture of the way you obtained this smallest standard deviation. Are there more than one way to get this smallest standard deviation? c. Can you have a standard deviation of zero? If so, explain how. How many different ways can you do this? d. What do you think you would need to change about the app and the numbers included on the app to come up with a standard deviation larger than the largest you found? e. What does standard deviation actually mean? In general, what make ls larger? What makes it smaller? f. Finally, look back at #1. Calculate the standard deviation for each racelethnicity (meaning, what is the standard deviation of student enrollment for years for African American students? American Indian/Aslaskan Native? Asian! Pacific Island...? 3. Compare the standard deviations to the total to the standard deviation of 299.65 for all students/all races. Which group of students had the most variation in student enrollment over time? Least? b. What does it mean that one group had a high standard deviation and another had a low standard deviation? Look at the numbers and give an example of what made the standard deviation high vs. low. (him, think about the app) 7) In at least 200 words: what does the standard deviation actually measure? [each student must answer this part individuallyr even if working in a group] You MUST use correct commands in Excel or Google sheets to complete this project. Please make sure you organize your file neatly. Write the question number and actual question you are solving and put things in order in an organized manner. Use the appropriate notation and tables as demonstrated in the eText and course materials. Round all numbers to the nearest whole number, and round the standard deviation to the hundredths place for all problems on this project. Make sure your project is neatly typed, includes a cover page, and each portion is labeled (include original problem and problem number) Here are some resources to help create graphs: - Data Set for the project . Google Sheets Calculations Video . Pie Chart in Google Sheets - Organizing data to make pie charts in Google Sheets and more detail on how to create - Bar Graphs in Google Sheets - Histogram in Google Sheets - Making Frequency Distribution Tables
Step by Step Solution
There are 3 Steps involved in it
Step: 1
Get Instant Access to Expert-Tailored Solutions
See step-by-step solutions with expert insights and AI powered tools for academic success
Step: 2
Step: 3
Ace Your Homework with AI
Get the answers you need in no time with our AI-driven, step-by-step assistance