

Answered step by step
Verified Expert Solution
Question
1 Approved Answer
Sir i am stuck for this question only part 2 and 3 Histogram on Google sheet (link are just ) https://youtu.be/0jFCBbvSS4U You MUST use correct
Sir i am stuck for this question
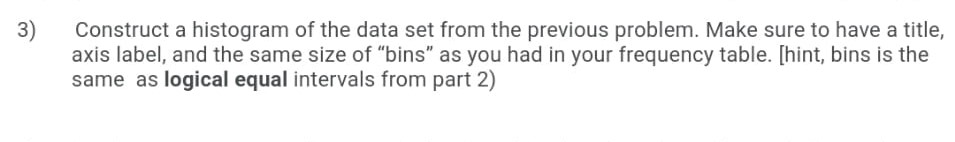
only part 2 and 3
Histogram on Google sheet (link are just )
https://youtu.be/0jFCBbvSS4U
Step by Step Solution
There are 3 Steps involved in it
Step: 1

Get Instant Access to Expert-Tailored Solutions
See step-by-step solutions with expert insights and AI powered tools for academic success
Step: 2

Step: 3
Ace Your Homework with AI
Get the answers you need in no time with our AI-driven, step-by-step assistance
Get Started
Nonlinear Systems And Their Remarkable Mathematical Structures Volume 3, Contributions From China
Authors: Norbert Euler, Da jun Zhang
1st Edition
1000423301, 9781000423303