Answered step by step
Verified Expert Solution
Link Copied!

Question

1 Approved Answer

Ska Brewing Company is a producer of fine craft beers located in Durango, Colorado. With its flagships Ale and Lager, they have enjoyed double-digit growth

image text in transcribed

Ska Brewing Company is a producer of fine craft beers located in Durango, Colorado. With its flagships Ale and Lager, they have enjoyed double-digit growth for more than a decade with no signs of allowing down.

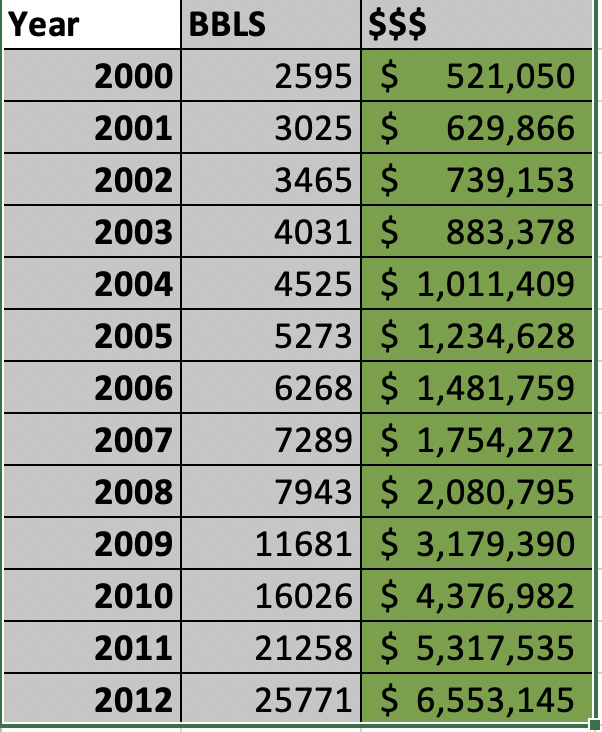
Ska was founded in 1995, and through hard work and laser-like focus on brewing great beer continued to grow. In 2012, Ska brewed more than 25,000 barrels of beer (1 barrel = 2 standard kegs = 4,032 ounces) with sales exceeding $6.5 million.

Using the Excel screenshot data below, use the methods of descriptive statistics analytics to summarize the Skaannual datalisted in table 1. Discuss your findings.

a. Include a summary of each variable (number of barrels sold and gross annual sales) in the data set. Use histograms, descriptive statistics, and Empirical rule to gain insight and detect data patterns.Your answer should refer to histograms, Empirical rule, and descriptive statistics (mean, median, mode, standard deviation, skewness, and kurtosis) to explain detected data patterns (i.e. increasing/decreasing/stable trends, whether the data is normally distributed based on Empirical rule, ...).

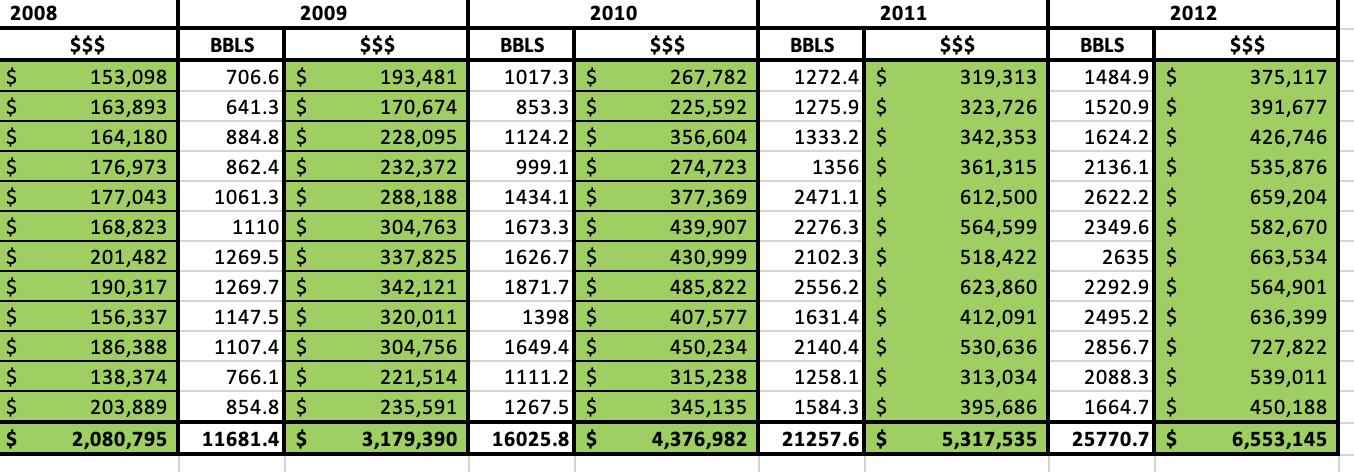
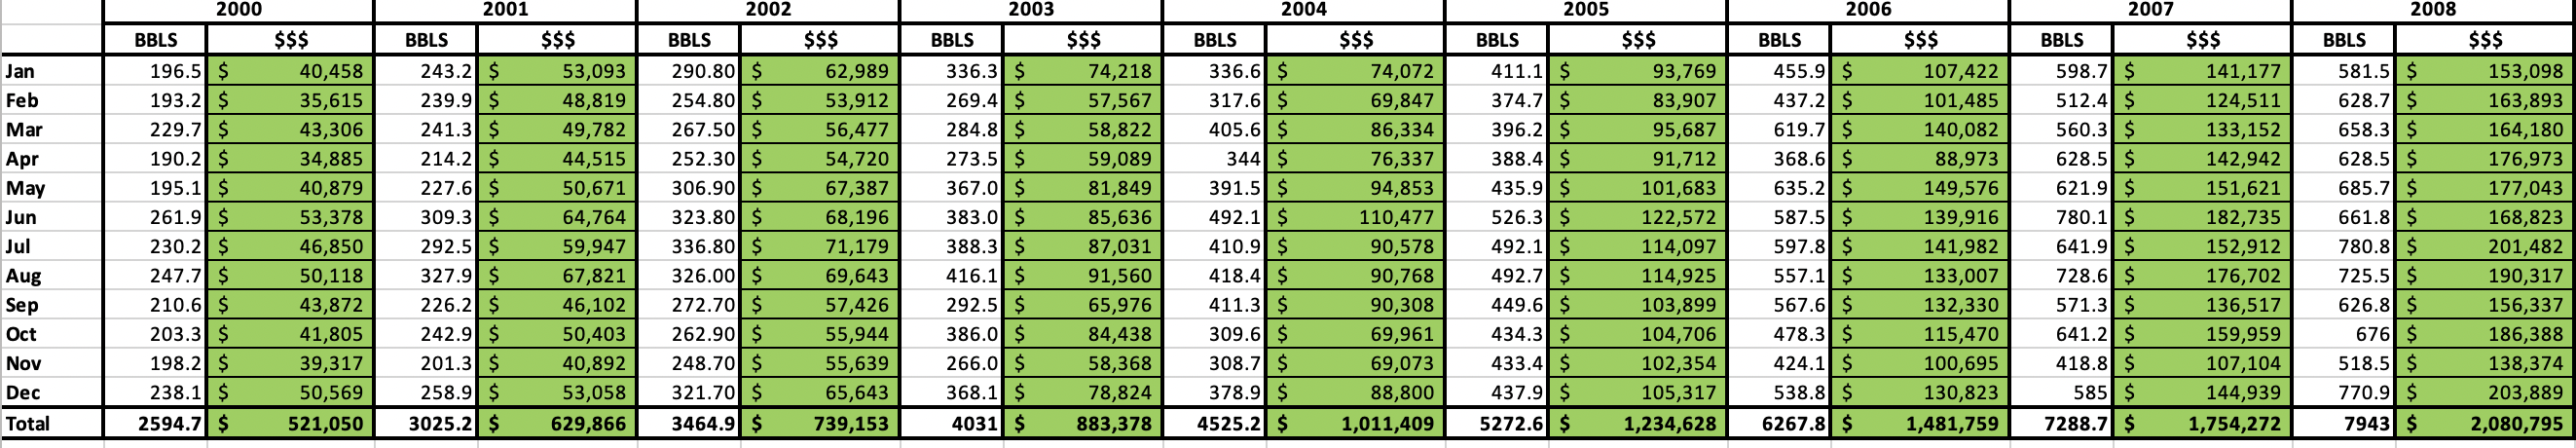
For the next two parts of this problem, use the descriptive statisticsto summarize the Skamonthly datalisted below.

b.Discuss your findings with respect to theappropriatemeasures of central tendency (mean, median, and mode), measures of dispersion (range and standard deviation), skewness, and kurtosis of the data.Refer to Empirical rule as a part of interpretation of the monthly data patterns.

c.One concern at Ska is seasonal variation. The brewery is much busier during summer months than during winter months. Two possible explanations for this phenomenon are that 1) people simply buy more beer during summer, and 2) Ska releases two very popular seasonal beers, Mexican Logger and Euphoria Pale Ale at the beginning and end of summer season. To get a better handle on the seasonal variation at Ska, your task is to draw clear picture of what's happening (data visualization such as histogram and trend lines). Make sure to include in your answer, based on descriptive statistics, whether there appears to be seasonalvariation present in the monthly number of barrels sold and monthly gross sales comparing warm summer months to cold winter months.

d.For this part of problem, note that two pieces of data is provided, namely, number of barrels and monthly gross sales.Considering that there is obvious increasing trend in annual gross income, is this increase due to increase in number of barrels sold or price increase per barrel? Justify your answer based on descriptive statistics. Hint: you would need to calculate price per barrel based on gross income and number of barrels sold based on data provided.

image text in transcribedimage text in transcribedimage text in transcribed
Year BBLS $$$ 2000 2595 $ 521,050 2001 3025 $ 629,866 2002 3465 $ 739,153 2003 4031 $ 883,378 2004 4525 $ 1,011,409 2005 5273 $ 1,234,628 2006 6268 $ 1,481,759 2007 7289 $ 1,754,272 2008 7943 $ 2,080,795 2009 11681 $ 3,179,390 2010 16026 $ 4,376,982 2011 21258 $ 5,317,535 2012 25771 $ 6,553,1452000 2001 2002 2003 2004 2005 2006 2007 2008 BBLS $$s BBLS $$S BLS SSS BBLS $SS BBLS $$S BBLS SSS BBLS SSS BBLS $SS BBLS SSS Jan 196.5 $ 40,458 243.2 $ 53,093 290.80 $ 62,989 336.3 $ 74,218 336.6 $ 74,072 411.1 $ 93,769 455.9 $ 107,422 598.7 $ 141,177 581.5 $ 153,098 Feb 193.2 $ 35,615 239.9 $ 48,819 254.80 $ 53,912 269.4 $ 57,567 317.6 $ 69,847 374.7 $ 83,907 437.2 $ 101,485 512.4 $ 124,511 628.7 $ 163,893 Mar 229.7 $ 43,306 241.3 $ 49,782 267.50 $ 56,477 284.8 $ 58,822 405.6 $ 86,334 396.2 $ 95,687 619.7 $ 140,082 560.3 $ 133,152 658.3 $ 164,180 Apr 190.2 $ 34,885 214.2 $ 44,515 252.30 $ 54,720 273.5 $ 59,089 344 $ 76,337 388.4 $ 91,712 368.6 $ 88,973 628.5 $ 142,942 628.5 $ 176,973 May 195.1 $ 40,879 227.6 $ 50,671 306.90 $ 67,387 367.0 $ 31,849 391.5 $ 94,853 435.9 $ 101,683 635.2 $ 149,576 621.9 $ 151,621 685.7 $ 177,043 Jun 261.9 $ 53,378 309.3 $ 64,764 323.80 $ 68,196 383.0| $ 85,636 492.1 $ 110,477 526.3 $ 122,572 587.5 $ 139,916 780.1 $ 182,735 661.8 $ 168,823 Jul 230.2 $ 46,850 292.5 $ 59,947 336.80 $ 71,179 388.3 $ 87,031 410.9 $ 90,578 492.1 $ 14,097 597.8 $ 141,982 641.9 $ 152,912 780.8 $ 201,482 Aug 247.7 $ 50,118 327.9 $ 57,821 326.00 $ 69,643 416.1 $ 91,560 418.4 $ 90,768 492.7 $ 14,925 557.1 $ 133,007 728.6 $ 76,702 725.5 $ 190,317 Sep 210.6 $ 43,872 226.2 $ 46,102 272.70 $ 57,426 292.5 $ 65,976 411.3 $ 90,308 449.6 $ 103,899 567.6 $ 132,330 571.3 $ 36,517 626.8 $ 156,337 Oct 203.3 $ 41,805 242.9 $ 50,403 262.90 $ 55,944 386.0 $ 84,438 309.6 $ 69,961 434.3 $ 104,706 478.3 $ 115,470 641.2 $ 159,959 676 $ 186,388 Nov 198.2 $ 39,317 201.3 $ 40,892 248.70 $ 55 , 639 266.0 $ 58 , 368 308.7 $ 69,073 433.4 $ 102,354 424.1 $ 100,695 418.8 $ 107,104 518.5 $ 138,374 Dec 238.1 $ 50,569 258.9 $ 53,058 321.70 $ 65,643 368.1 $ 78,824 378.9 $ 88,800 437.9 $ 105,317 538.8 $ 130,823 585 $ 144,939 770.9 $ 203,889 ota 2594.7 $ 521,050 3025.2 $ 629,866 3464.9 $ 739,153 4031 $ 883,378 4525.2 $ 1,011,409 5272.6 $ 1,234,628 6267.8 $ 1,481,759 7288.7 $ 1,754,272 7943 $ 2,080,7952008 2009 2010 2011 2012 $$$ BBLS $$$ BBLS $$$ BBLS $$$ BBLS $$$ 153,098 706.6 ur 193,481 1017.3 $ 267,782 1272.4 319,313 1484.9 375,117 163,893 641.3 170,674 853.3 225,592 1275.9 323,726 1520.9 391,677 164,180 884.8 228,095 1124.2 356,604 1333.2 342,353 1624.2 426,746 176,973 862.4 ur 232,372 999.1 274,723 1356 361,315 2136.1 $ 535,876 177,043 1061.3 288,188 1434.1 377,369 2471.1 612,500 2622.2 659,204 168,823 1110 304,763 1673.3 439,907 2276.3 564,599 2349.6 582,670 201,482 1269.5 337,825 1626.7 430,999 2102.3 518,422 2635 663,534 190,317 1269.7 342,121 1871.7 485,822 2556.2 623,860 2292.9 564,901 156,337 1147.5 320,011 1398 407,577 1631.4 412,091 2495.2 636,399 186,388 1107.4 304,756 1649.4 450,234 2140.4 530,636 2856.7 727,822 138,374 766.1 221,514 1111.2 S 315,238 1258.1 313,034 2088.3 539,011 203,889 854.8 S 235,591 1267.5 $ 345,135 1584.3 395,686 1664.7 450,188 2,080,795 11681.4 3,179,390 16025.8 $ 4,376,982 21257.6 $ 5,317,535 25770.7 S 6,553,145

Step by Step Solution

There are 3 Steps involved in it

Step: 1

blur-text-image

Get Instant Access to Expert-Tailored Solutions

See step-by-step solutions with expert insights and AI powered tools for academic success

Step: 2

blur-text-image

Step: 3

blur-text-image

Ace Your Homework with AI

Get the answers you need in no time with our AI-driven, step-by-step assistance

Get Started

Recommended Textbook for

An Introduction To Categorical Data Analysis

Authors: Alan Agresti

2nd Edition

0470653205, 9780470653203

More Books

Students also viewed these Mathematics questions