Answered step by step
Verified Expert Solution
Question
1 Approved Answer
Sketch a diagram for the boron-doped indium phosphide wafer indicating temperature dependence of the conductivity. The sketch must have a plot of the conductivity

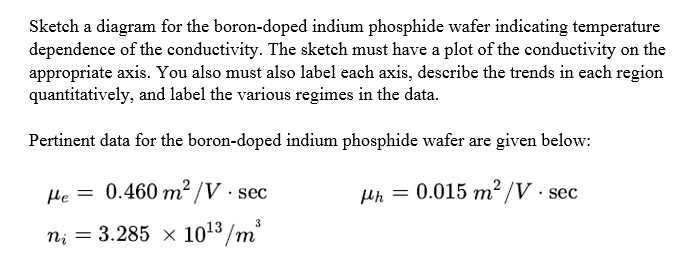
Sketch a diagram for the boron-doped indium phosphide wafer indicating temperature dependence of the conductivity. The sketch must have a plot of the conductivity on the appropriate axis. You also must also label each axis, describe the trends in each region quantitatively, and label the various regimes in the data. Pertinent data for the boron-doped indium phosphide wafer are given below: He = 0.460 m2 /V sec Hh = 0.015 m2 /V sec sec 3 n = 3.285 1013 /m
Step by Step Solution
★★★★★
3.42 Rating (165 Votes )
There are 3 Steps involved in it
Step: 1

Get Instant Access to Expert-Tailored Solutions
See step-by-step solutions with expert insights and AI powered tools for academic success
Step: 2

Step: 3

Document Format ( 2 attachments)
6366b10e67172_238368.pdf
180 KBs PDF File
6366b10e67172_238368.docx
120 KBs Word File
Ace Your Homework with AI
Get the answers you need in no time with our AI-driven, step-by-step assistance
Get Started


