

Question
Sketch graphs of two functions, as in Figure 3.7. (No equations are needed.) For each function, which we'll refer to as f (X), sketch the
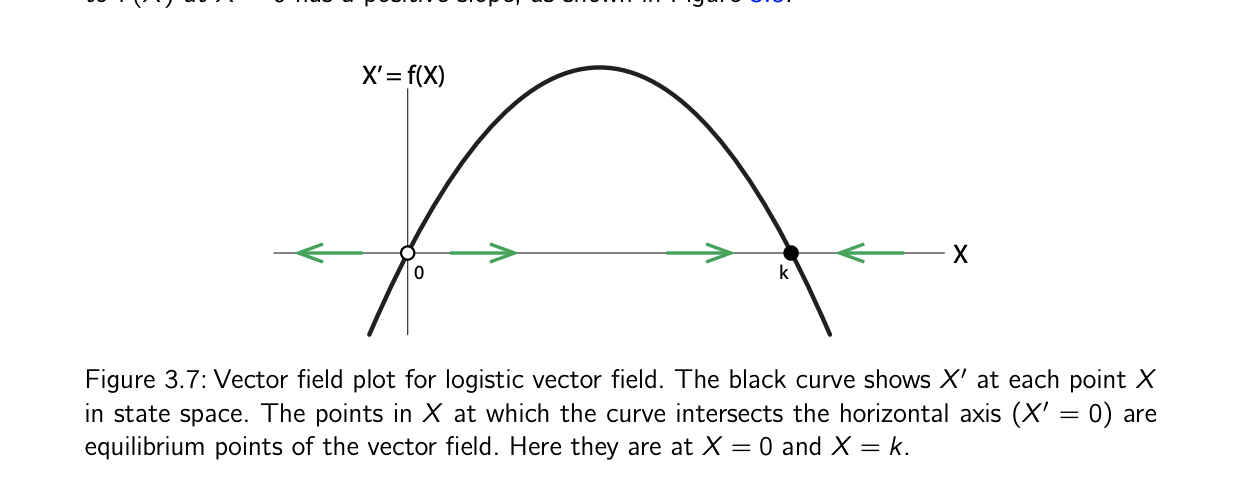
Sketch graphs of two functions, as in Figure 3.7. (No equations are needed.) For each function, which we'll refer to as f (X), sketch the vector field of X = f (X). Mark the equilibrium points and indicate their stability. the graph below is the figure 3.7
Step by Step Solution
There are 3 Steps involved in it
Step: 1

Get Instant Access to Expert-Tailored Solutions
See step-by-step solutions with expert insights and AI powered tools for academic success
Step: 2

Step: 3
Ace Your Homework with AI
Get the answers you need in no time with our AI-driven, step-by-step assistance
Get Started
Essential Calculus Early Transcendental Functions
Authors: Ron Larson, Robert P. Hostetler, Bruce H. Edwards
1st Edition
618879188, 618879182, 978-0618879182