So I need help on this homework assignment. Please help its due today!! In-class graphing activity Make the following graphs and paste (special!) them into
So I need help on this homework assignment. Please help its due today!!
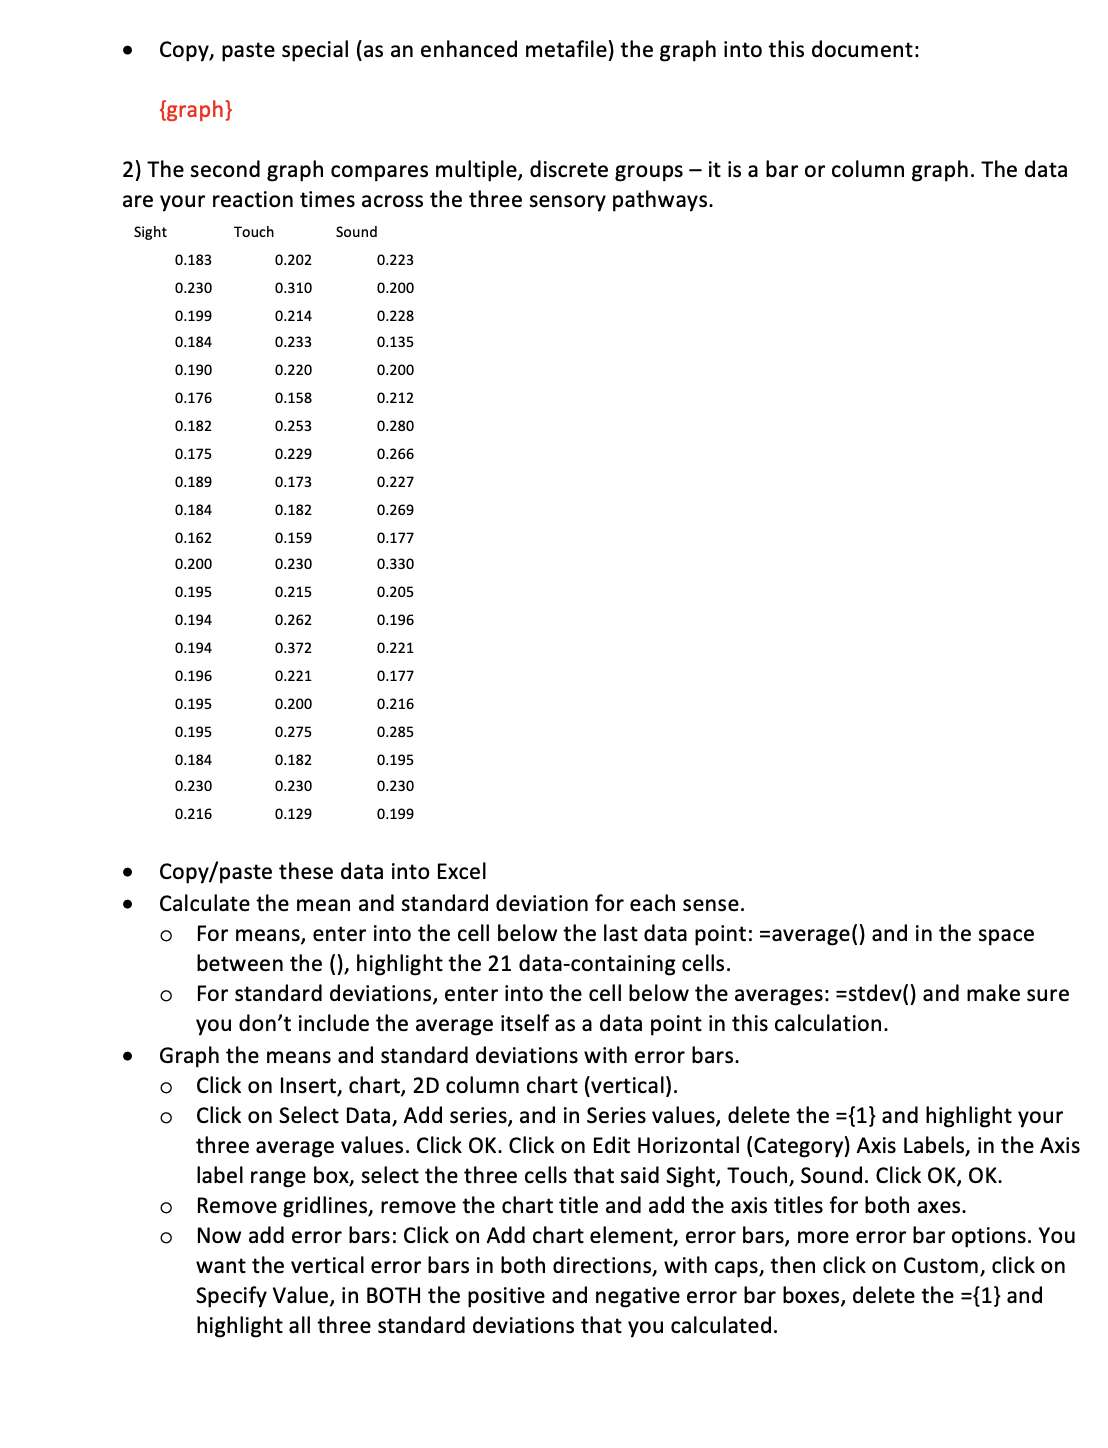
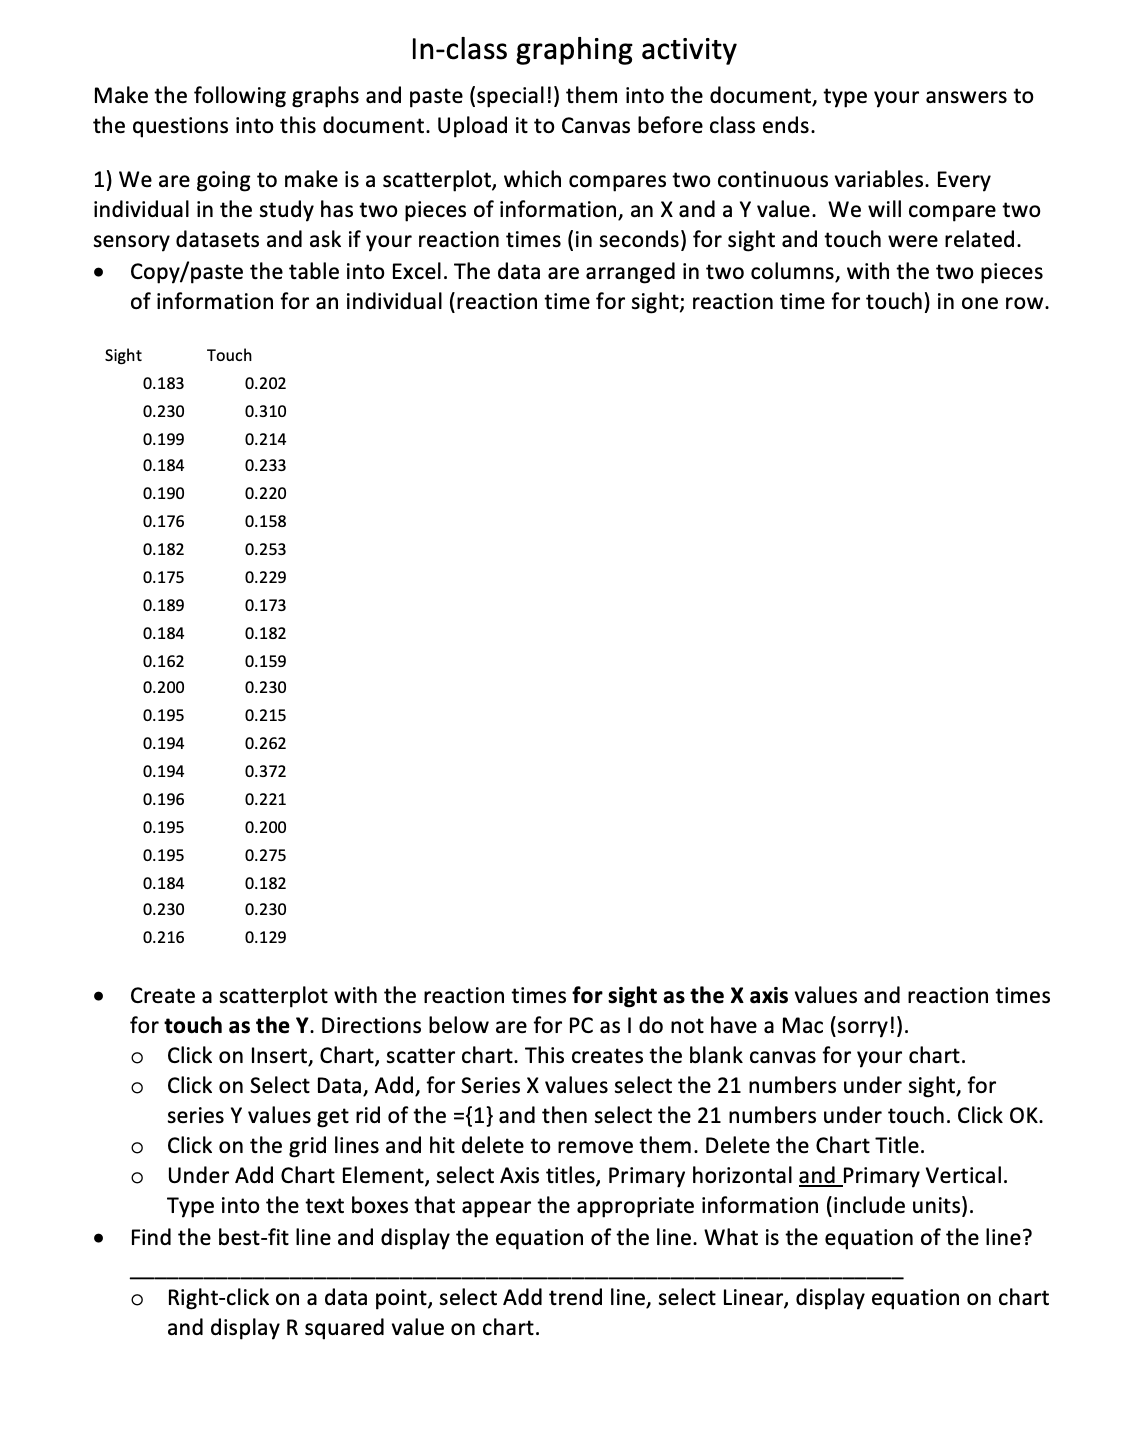
In-class graphing activity Make the following graphs and paste (special!) them into the document, type your answers to the questions into this document. Upload it to Canvas before class ends. 1) We are going to make is a scatterplot, which compares two continuous variables. Every individual in the study has two pieces of information, an X and a Y value. We will compare two sensory datasets and ask if your reaction times (in seconds) for sight and touch were related. 0 Copy/paste the table into Excel. The data are arranged in two columns, with the two pieces of information for an individual (reaction time for sight; reaction time for touch) in one row. Sight Touch 0.183 0.202 0.230 0.3 10 0.199 0.2 14 0.184 0.233 0.190 0.220 0.176 0.158 0.182 0.253 0.175 0.229 0.189 0.173 0.184 0.182 0.162 0.159 0.200 0.230 0.195 0.2 15 0.194 0.262 0.194 0.372 O. 196 O. 221 0.195 0.200 0.195 0.275 0.184 0.182 0.230 0.230 0.2 16 0.129 0 Create a scatterplot with the reaction times for sight as the X axis values and reaction times for touch as the Y. Directions below are for PC as I do not have a Mac (sorry!). 0 O O 0 Click on Insert, Chart, scatter chart. This creates the blank canvas for your chart. Click on Select Data, Add, for Series X values select the 21 numbers under sight, for series Y values get rid of the ={1} and then select the 21 numbers under touch. Click OK. Click on the grid lines and hit delete to remove them. Delete the Chart Title. Under Add Chart Element, select Axis titles, Primary horizontal MPrimary Vertical. Type into the text boxes that appear the appropriate information (include units). 0 Find the best-fit line and display the equation of the line. What is the equation of the line? 0 Right-click on a data point, select Add trend line, select Linear, display equation on chart and display R squared value on chart. o Copy, paste special (as an enhanced metafile} the graph into this document: {graph} 2} The second graph compares multiple, discrete groups it is a bar or column graph. The data are your reaction times across the three sensory pathways. Sig ht Touch So un d 0.183 0.202 0.223 0.230 0.3 10 0.200 0.199 0.2 14 0.223 0.184 0.233 0.135 0.190 0.220 0.200 0.1?6 0.153 0.212 0.182 0.253 0.280 0.1?5 0.229 0.266 0.189 0.1?3 0.22? 0.184 0.182 0.269 0.162 0.159 0.12? 0.200 0.230 0.330 0.195 0.215 0.205 0.194 0.262 0.196 0.194 0.3?2 0.221 0.196 0.221 0.12? 0.195 0.200 0.216 0.195 0.2?5 0.285 0.184 0.182 0.195 0.230 0.230 0.230 0.216 0.129 0.199 in Copy/paste these data into Excel in Calculate the mean and standard deviation for each sense. 0 For means, enter into the cell below the last data point: =average(} and in the space between the (l, highlight the 21 data-containing cells. 0 For standard deviations, enter into the cell below the averages: =stdev() and make sure you don't include the average itself as a data point in this calculation. 0 Graph the means and standard deviations with error bars. 0 Click on Insert, chart, 20 column chart (vertical). 0 Click on Select Data, Add series, and in Series values, delete the ={1} and highlight your three average values. Click OK. Click on Edit Horizontal (Category) Axis Labels, in the Axis label range box, select the three cells that said Sight, Touch, Sound. Click 0K, 0K. Remove gridlines, remove the chart title and add the axis titles for both axes. 0 Now add error bars: Click on Add chart element, error bars, more error bar options. You want the vertical error bars in both directions, with caps, then click on Custom, click on Specify Value, in BOTH the positive and negative error bar boxes, delete the ={1} and highlight all three standard deviations that you calculated. 0 o Copy, paste special (as an enhanced metafile) the graph into this document: {graph} Now answer the following questions: 1) Do you think there is a relationship between the reaction times when sight is the sense and the reaction times when touch is the sense? Why or why not? 2) For which sense did the class have the shortest average reaction time? 3} For which sense did the class have the smallest amount of variance in the dataset (smallest error bars?)
Step by Step Solution
There are 3 Steps involved in it
Step: 1
Get Instant Access to Expert-Tailored Solutions
See step-by-step solutions with expert insights and AI powered tools for academic success
Step: 2
Step: 3
Ace Your Homework with AI
Get the answers you need in no time with our AI-driven, step-by-step assistance