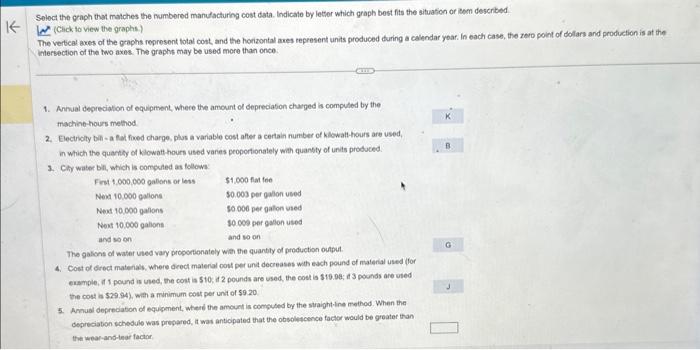
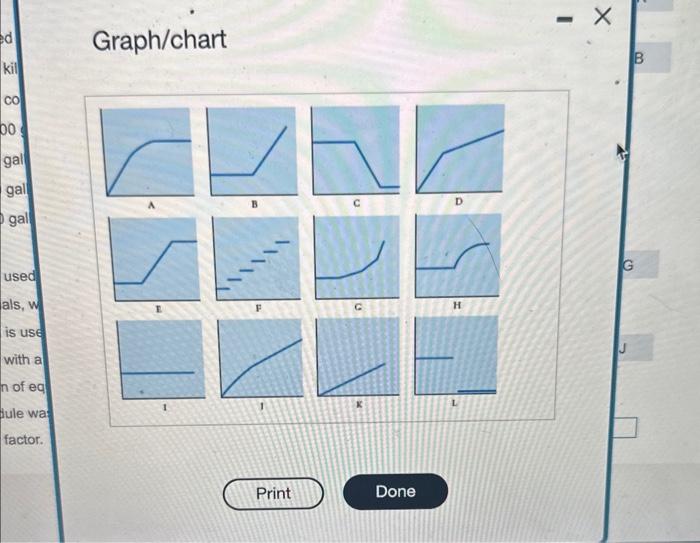
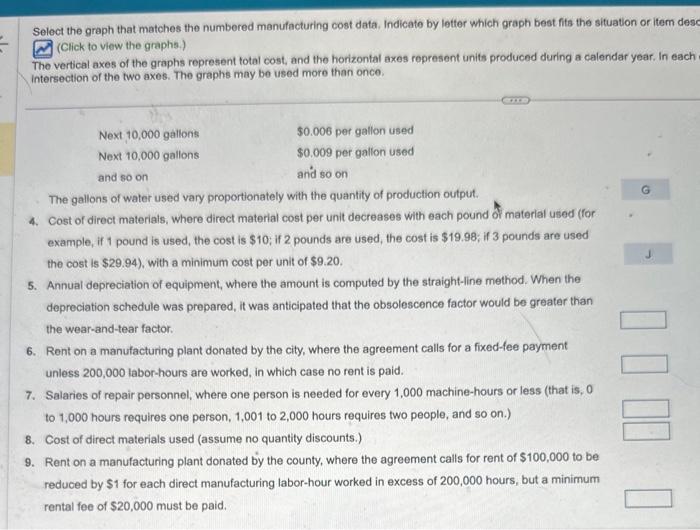
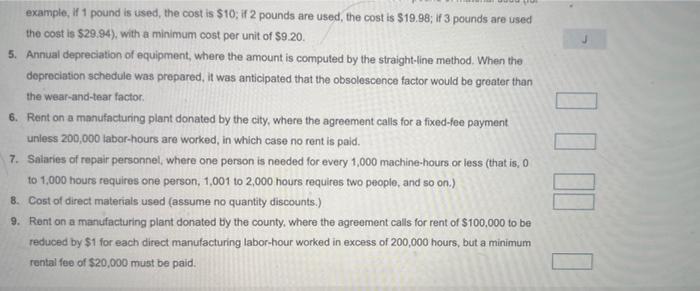
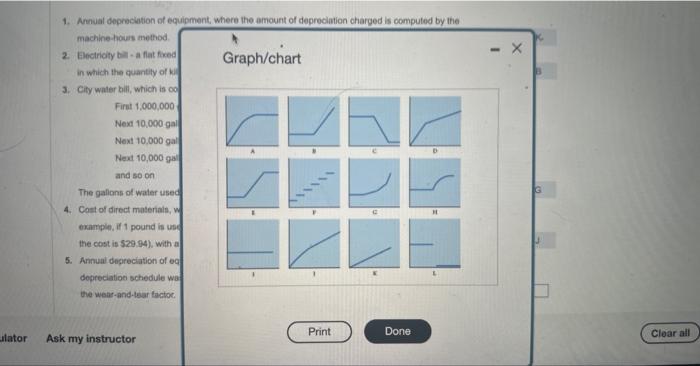
Soloct the graph that matches the numbered manufacturing cost data. Indicate by letter which graph best fits the situafion or Bem described. AN (click to view the graphs) The vertical aves of the graphs represent total cott and the horizontal akes represent units produced during a calendar year. In each casc, the zero point of dolars and production is at the intersection of the two axes. The graphs may be used more than once. 1. Arival degreciation of equipment, whece the amount of deprediasion churged is computed by the machino-hours method 2. Electriolty bili - a fal fowed charge, plust a variable cost after a certain number of klowath-hours are used. in which the quartly of klowatt hours used yanes proporionately with quansty of units probuced. 3. Chy water bih which is comouted as follews: The galons of water uned vary procorionately with the quantily of production output 4. Cost ol drect matefaks, Where drect material oost per unit decreases whth each pound of material used (for eumple; 11 pound is used, the cost is 510 , i 2 pounds are used, the cost is 510.94 : a 3 poonds are uted the cost i 529.94 ), with a minimum cost per unt of $9.20 5. Ameid depreciation of equigenent, wherd the amount is computed by the straightime method. When the depreciaton schedule was pregared, it was antiopated that the obsoletcence foctor would be groater than the wear-and-tear factor Graph/chart Select the graph that matches the numbered manufacturing cost data. Indicate by letter which graph best fits the situation or item desc (Click to view the graphs.) The vertical axes of the graphs represent total cost, and the horizontal axes represent units produced during a calendar year. In each intersection of the two axes. The graphs may be used more than once. The gallons of water used vary proportionately with the quantity of production output. 4. Cost of direct materials, where direct material cost per unit decreases with each pound of material used (for example, if 1 pound is used, the cost is $10; if 2 pounds are used, the cost is $19.98; if 3 pounds are used the cost is $29.94 ), with a minimum cost per unit of $9.20. 5. Annual depreciation of equipment, where the amount is computed by the straight-line method. When the depreciation schedule was prepared, it was anticipated that the obsolescence factor would be greater than the wear-and-tear factor. 6. Rent on a manufacturing plant donated by the city, where the agreement calls for a fixed-fee payment unless 200,000 labor-hours are worked, in which case no rent is paid. 7. Salaries of repair personnel, where one person is needed for every 1,000 machine-hours or less (that is, 0 to 1,000 hours requires one person, 1,001 to 2,000 hours requires two people, and so on.) 8. Cost of direct materials used (assume no quantity discounts.) 9. Rent on a manufacturing plant donated by the county, where the agreement calls for rent of $100,000 to be reduced by $1 for each direct manufacturing labor-hour worked in excess of 200,000 hours, but a minimum rental fee of $20,000 must be paid. Solost the graph that matahes the numbered manufocturing cost dati. Indicate by lottor which graph best fis the sitiation or iteen doscribed Le (Cick to vinw the praphis) The veticai axess of the grapha represent total cost, and the horizontal axes ropresent units produced duting a calendar year. In each case, the zero point of dollars and praducton is at ife intarsection of the hwo axos. The graptis may be used more than once. Nexe 10,005 gatont $0.006 per gallon used Noxi 10,000 galons 50.009 per gation used and so con ane 50 on The gations of water used vary proporionatily w th the quantey of production oulput. 4. Cost of drect maleiain, where direct material cost per unit decreases with each pound of material uaed flor Erantipe, if 1 pound is used, the cost is 510 ; if 2 pounds are used, the cost is 519.90 : if 3 pounds are used the coet is 524:94) with s rainionum cost per unit of $9.20. 5. Arnoal doprecialion of equiprtent, where the amount is computed by the straight-line method. Whon the dopenciation schedtile was prepared. it was anticipiled that the obsolescence factor would be greator than The wuar-anc-lear factor: example, If 1 pound is used, the cost is $10; if 2 pounds are used, the cost is $19.98; if 3 pounds are used the cost is $29.94 ), with a minimum cost per unit of $9.20. 5. Annual depreciation of equipment, where the amount is computed by the straight-line method. When the depreciation schedule was prepared, it was anticipated that the obsolescence factor would be greater than the wear-and-tear factor. 6. Rent on a manufacturing plant donated by the city, where the agreement calls for a fixed-fee payment unless 200,000 labor-hours are worked, in which case no rent is paid. 7. Salaries of repair personnel, where one person is needed for every 1,000 machine-hours or iess (that is, 0 to 1,000 hours requires one person, 1,001 to 2,000 hours requires two people, and so on.) 8. Cost of direct materials used (assume no quantity discounts.) 9. Rent on a manufacturing plant donated by the county, where the agreement calls for rent of $100,000 to be reduced by $1 for each direct manulacturing labor-hour worked in excess of 200,000 hours, but a minimum rental fee of $20,000 must be paid. 1. Arenal deprecketion of equipment, where the amount of depreciation charged is computed by the machine-hours method 2. Eloctricity bill - a flat fixed Soloct the graph that matches the numbered manufacturing cost data. Indicate by letter which graph best fits the situafion or Bem described. AN (click to view the graphs) The vertical aves of the graphs represent total cott and the horizontal akes represent units produced during a calendar year. In each casc, the zero point of dolars and production is at the intersection of the two axes. The graphs may be used more than once. 1. Arival degreciation of equipment, whece the amount of deprediasion churged is computed by the machino-hours method 2. Electriolty bili - a fal fowed charge, plust a variable cost after a certain number of klowath-hours are used. in which the quartly of klowatt hours used yanes proporionately with quansty of units probuced. 3. Chy water bih which is comouted as follews: The galons of water uned vary procorionately with the quantily of production output 4. Cost ol drect matefaks, Where drect material oost per unit decreases whth each pound of material used (for eumple; 11 pound is used, the cost is 510 , i 2 pounds are used, the cost is 510.94 : a 3 poonds are uted the cost i 529.94 ), with a minimum cost per unt of $9.20 5. Ameid depreciation of equigenent, wherd the amount is computed by the straightime method. When the depreciaton schedule was pregared, it was antiopated that the obsoletcence foctor would be groater than the wear-and-tear factor Graph/chart Select the graph that matches the numbered manufacturing cost data. Indicate by letter which graph best fits the situation or item desc (Click to view the graphs.) The vertical axes of the graphs represent total cost, and the horizontal axes represent units produced during a calendar year. In each intersection of the two axes. The graphs may be used more than once. The gallons of water used vary proportionately with the quantity of production output. 4. Cost of direct materials, where direct material cost per unit decreases with each pound of material used (for example, if 1 pound is used, the cost is $10; if 2 pounds are used, the cost is $19.98; if 3 pounds are used the cost is $29.94 ), with a minimum cost per unit of $9.20. 5. Annual depreciation of equipment, where the amount is computed by the straight-line method. When the depreciation schedule was prepared, it was anticipated that the obsolescence factor would be greater than the wear-and-tear factor. 6. Rent on a manufacturing plant donated by the city, where the agreement calls for a fixed-fee payment unless 200,000 labor-hours are worked, in which case no rent is paid. 7. Salaries of repair personnel, where one person is needed for every 1,000 machine-hours or less (that is, 0 to 1,000 hours requires one person, 1,001 to 2,000 hours requires two people, and so on.) 8. Cost of direct materials used (assume no quantity discounts.) 9. Rent on a manufacturing plant donated by the county, where the agreement calls for rent of $100,000 to be reduced by $1 for each direct manufacturing labor-hour worked in excess of 200,000 hours, but a minimum rental fee of $20,000 must be paid. Solost the graph that matahes the numbered manufocturing cost dati. Indicate by lottor which graph best fis the sitiation or iteen doscribed Le (Cick to vinw the praphis) The veticai axess of the grapha represent total cost, and the horizontal axes ropresent units produced duting a calendar year. In each case, the zero point of dollars and praducton is at ife intarsection of the hwo axos. The graptis may be used more than once. Nexe 10,005 gatont $0.006 per gallon used Noxi 10,000 galons 50.009 per gation used and so con ane 50 on The gations of water used vary proporionatily w th the quantey of production oulput. 4. Cost of drect maleiain, where direct material cost per unit decreases with each pound of material uaed flor Erantipe, if 1 pound is used, the cost is 510 ; if 2 pounds are used, the cost is 519.90 : if 3 pounds are used the coet is 524:94) with s rainionum cost per unit of $9.20. 5. Arnoal doprecialion of equiprtent, where the amount is computed by the straight-line method. Whon the dopenciation schedtile was prepared. it was anticipiled that the obsolescence factor would be greator than The wuar-anc-lear factor: example, If 1 pound is used, the cost is $10; if 2 pounds are used, the cost is $19.98; if 3 pounds are used the cost is $29.94 ), with a minimum cost per unit of $9.20. 5. Annual depreciation of equipment, where the amount is computed by the straight-line method. When the depreciation schedule was prepared, it was anticipated that the obsolescence factor would be greater than the wear-and-tear factor. 6. Rent on a manufacturing plant donated by the city, where the agreement calls for a fixed-fee payment unless 200,000 labor-hours are worked, in which case no rent is paid. 7. Salaries of repair personnel, where one person is needed for every 1,000 machine-hours or iess (that is, 0 to 1,000 hours requires one person, 1,001 to 2,000 hours requires two people, and so on.) 8. Cost of direct materials used (assume no quantity discounts.) 9. Rent on a manufacturing plant donated by the county, where the agreement calls for rent of $100,000 to be reduced by $1 for each direct manulacturing labor-hour worked in excess of 200,000 hours, but a minimum rental fee of $20,000 must be paid. 1. Arenal deprecketion of equipment, where the amount of depreciation charged is computed by the machine-hours method 2. Eloctricity bill - a flat fixed