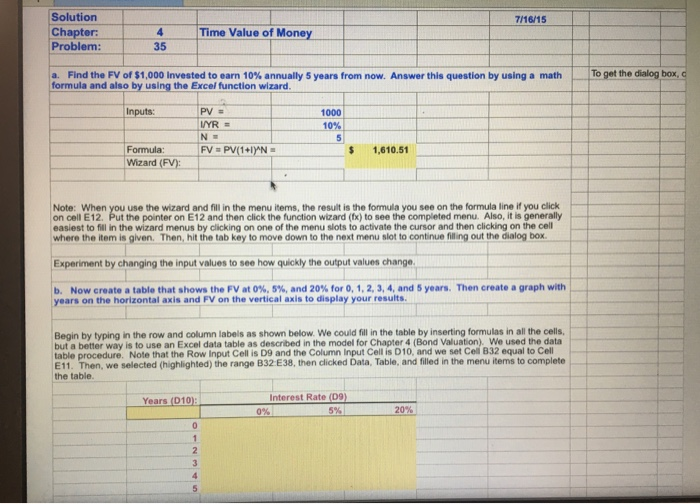
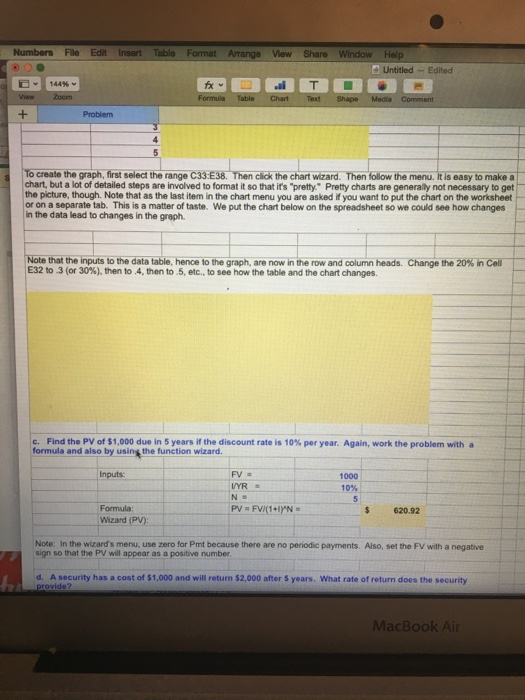
Solution 7/16/15 Chapter:4 Problem: Time Value of Money 35 To get the a. Find the FV of $1,000 invested to earn 10% annually 5 years from now. Answer this question by using a math formula and also by using the Excel function wizard box Inputs PV 1000 10% Formula:F PV (1+IPN Wizard (FV): 1,610.5 Note: When you use the wizard and fill in the menu items, the result is the formula you see on the formula line if you click on cell E12. Put the pointer on E12 and then click the function wizard (tx) to see the completed menu. Also, it is generally easiest to fill in the wizard menus by clicking on one of the menu slots to activate the cursor and then clicking on the cell where the item is given. Then, hit the tab key to move down to the next menu slot to continue filling out the dialog box. Experiment by changing the input values to see how quickly the output values change. b. Now create a table that shows the FV at 0%, 5%, and 20% for 0, 1, 2, 3, 4, and 5 years. years on the horizontal axis and FV on the vertical axis to display your results Then create a graph with Begin by typing in the row and column labels as shown below We could fill in the table by inserting formulas in all the cells, but a better way is to use an Excel data table as descibed in the model for Chapter 4 (Bond Valuation). We used the data table E11. Then, we selected (highlighted) the range B32 E38, then cdlicked Data, Table, and filled in the menu items to complete the table. t Cell is D10, and we set Cell B32 equal to Cell Note that the Row Input Cell is D9 and the Column Interest Rate (D9 Years (D10) 0% 20% Numbers File Edit Insart Table Format Arrange View Share Window Heip Untitled Edited Problem To create the graph, first select the range C33:E38. Then click the chart wizard. Then follow the menu. It is easy to make a chart, but a lot of detailed steps are involved to format it so that it's "pretty" Pretty charts are generally not necessary to get the picture, though. Note that as the last item in the chart menu you are asked if you want to put the chart on the worksheet or on a separate tab. This is a matter of taste. We put the chart below on the spreadsheet so we could see how changes in the data lead to changes in the greph. that the inputs to the data table, hence to the graph, are now in the row and column heads. Change the 20% in ar E32 to .3 (or 30%), then to .4, then to .5, etc., to see how the table and the chart changes. c. Find the PV of $1,000 due in 5 years if the discount rate is 10% per year. Again, work the problem with a formula and also by using the function wizard Inputs: 1000 10% VYR Formula $ 620.92 Wizard (PV) Note: In the wizard's menu, use zero for Pmt because there are no periodic payments. Also, set the FV with a negative sign so that the PV will appear as a positive number d. A security has a cost of $1,000 and will return $2,000 after 5 years. What rate of return does the security MacBook Air