Answered step by step
Verified Expert Solution
Question
1 Approved Answer
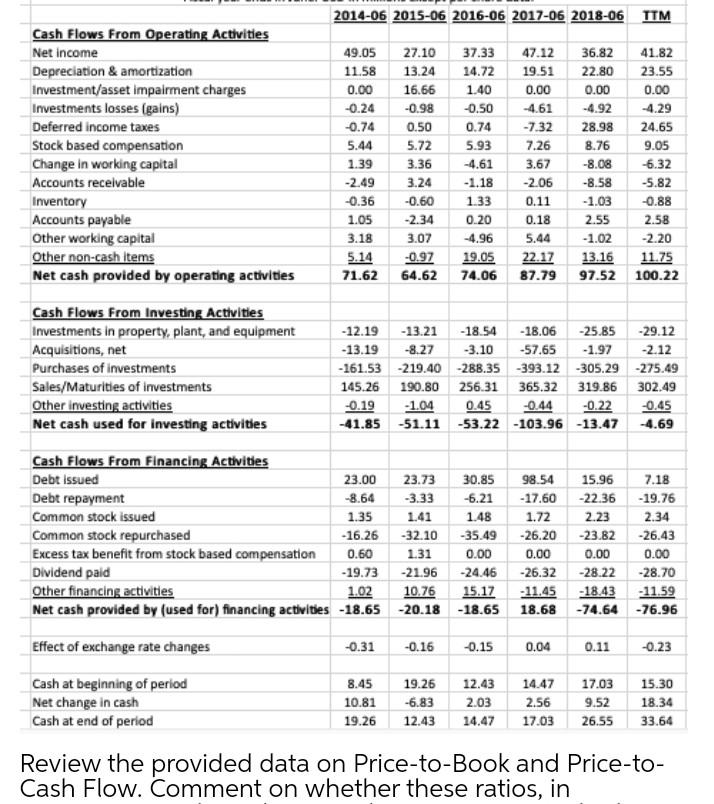
solve carefully or skip. solve carefully or down word 2014-06 2015-06 2016-06 2017-06 2018-06 TTM Cash Flows From Operating Activities Net income Depreciation & amortization
solve carefully or skip.


solve carefully or down word
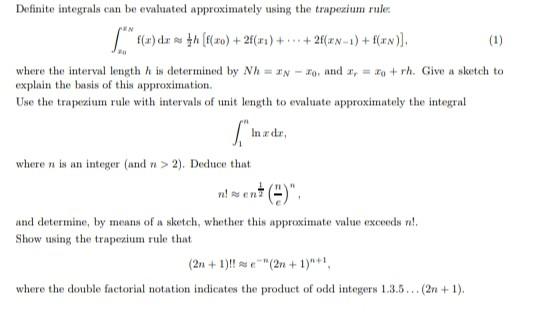
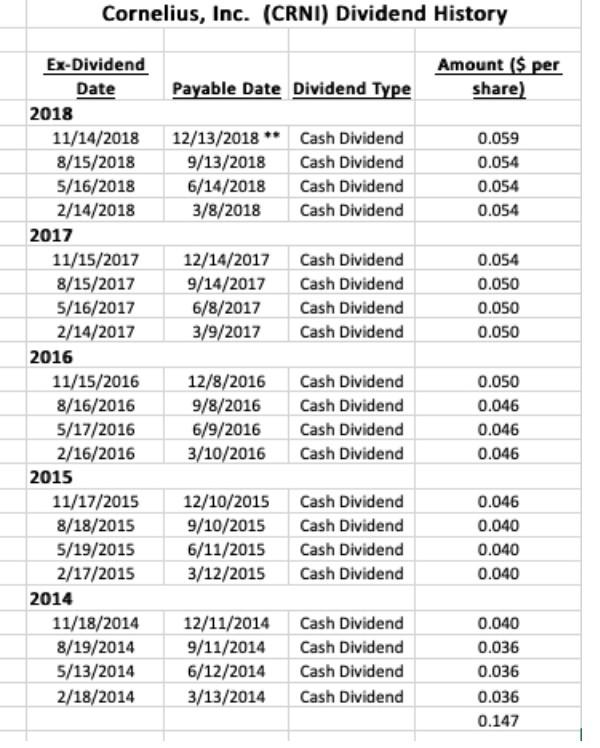
2014-06 2015-06 2016-06 2017-06 2018-06 TTM Cash Flows From Operating Activities Net income Depreciation & amortization Investment/asset impairment charges Investments losses (gains) Deferred income taxes Stock based compensation Change in working capital Accounts recevable Inventory Accounts payable Other working capital Other non-cash Items Net cash provided by operating activities 49.05 11.58 0.00 -0.24 -0.74 5.44 1.39 -2.49 -0.36 1.05 3.18 5.14 71.62 27.10 13.24 16.66 -0.98 0.50 5.72 3.36 3.24 -0.60 -2.34 3.07 -0.97 64.62 37.33 47.12 14.72 19.51 1.40 0.00 -0.50 -4.61 0.74 -7.32 5.93 7.26 -4.61 3.67 -1.18 -2.06 1.33 0.11 0.20 0.18 -4.96 5.44 19.05 22.17 74.06 87.79 36.82 41.82 22.80 23.55 0.00 0.00 -4.92 -4.29 28.98 24.65 8.76 9.05 -8.08 -6.32 -8.58 -5.82 -1.03 -0.88 2.55 2.58 -1.02 -2.20 13.16 11.75 97.52 100.22 Cash Flows From Investing Activities Investments in property, plant, and equipment Acquisitions, net Purchases of investments Sales/Maturities of investments Other investing activities Net cash used for investing activities - 12.19 -13.21 -18.54 -18.06 -25.85 -29.12 -13.19 -8.27 -3.10 -57.65 -1.97 -2.12 -161.53 -219.40 -288.35 -393.12 -305.29 -275.49 145.26 190.80 256.31 365.32 319.86 302.49 -0.19 -1.04 0.45 -0.44 -0.22 -0.45 -41.85 -51.11 -53.22 -103.96 -13.47 -4.69 Cash Flows From Financing Activities Debt issued 23.00 23.73 30.85 98.54 15.96 7.18 Debt repayment -8.64 -3.33 -6.21 -17.60 -22.36 -19.76 Common stock issued 1.35 1.41 1.48 1.72 2.23 2.34 Common stock repurchased - 16.26 -32.10 -35.49 -26.20 -23.82 -26.43 Excess tax benefit from stock based compensation 0.60 1.31 0.00 0.00 0.00 0.00 Dividend paid -19.73 -21.96 -24.46 -26.32 -28.22 -28.70 Other financing activities 1.02 10.76 15.17 -11.45 -18.43 - 11.59 Net cash provided by (used for) financing activities -18.65 -20.18 -18.65 18.68 -74.64 -76.96 Effect of exchange rate changes -0.31 -0.16 -0.15 0.04 0.11 -0.23 Cash at beginning of period Net change in cash Cash at end of period 8.45 10.81 19.26 19.26 -6.83 12.43 12.43 2.03 14.47 14.47 2.56 17.03 17.03 9.52 26.55 15.30 18.34 33.64 Review the provided data on Price-to-Book and Price-to- Cash Flow. Comment on whether these ratios, in Definite integrals can be evaluated approximately using the trapezium rule: /* f(a) dr = tn (ro) + 24 (ra) + - + 2(x2-1) + f(x)], where the interval length h is determined by Nh = IN - 1 and 2 = x + rh. Give a sketch to explain the basis of this approximation Use the trapzium rule with intervals of unit length to evaluate approximately the integral S In de where is an integer (und n > 2). Deduce that nalen ent(9)" and determine, by means of a sketch, whether this approximate value exceeds vi! Show using the trapezium rule thut (21+ 1)!! (2+1)** where the double factorial notation indicates the product of odd integers 1.3.5.. (2+1). Cornelius, Inc. (CRNI) Dividend History Amount ($ per share) Payable Date Dividend Type 12/13/2018 ** Cash Dividend 9/13/2018 Cash Dividend 6/14/2018 Cash Dividend 3/8/2018 Cash Dividend 0.059 0.054 0.054 0.054 12/14/2017 9/14/2017 6/8/2017 3/9/2017 Cash Dividend Cash Dividend Cash Dividend Cash Dividend 0.054 0.050 0.050 0.050 Ex-Dividend Date 2018 11/14/2018 8/15/2018 5/16/2018 2/14/2018 2017 11/15/2017 8/15/2017 5/16/2017 2/14/2017 2016 11/15/2016 8/16/2016 5/17/2016 2/16/2016 2015 11/17/2015 8/18/2015 5/19/2015 2/17/2015 2014 11/18/2014 8/19/2014 5/13/2014 2/18/2014 12/8/2016 9/8/2016 6/9/2016 3/10/2016 Cash Dividend Cash Dividend Cash Dividend Cash Dividend 0.050 0.046 0.046 0.046 12/10/2015 9/10/2015 6/11/2015 3/12/2015 Cash Dividend Cash Dividend Cash Dividend Cash Dividend 0.046 0.040 0.040 0.040 12/11/2014 9/11/2014 6/12/2014 3/13/2014 Cash Dividend Cash Dividend Cash Dividend Cash Dividend 0.040 0.036 0.036 0.036 0.147 2014-06 2015-06 2016-06 2017-06 2018-06 TTM Cash Flows From Operating Activities Net income Depreciation & amortization Investment/asset impairment charges Investments losses (gains) Deferred income taxes Stock based compensation Change in working capital Accounts recevable Inventory Accounts payable Other working capital Other non-cash Items Net cash provided by operating activities 49.05 11.58 0.00 -0.24 -0.74 5.44 1.39 -2.49 -0.36 1.05 3.18 5.14 71.62 27.10 13.24 16.66 -0.98 0.50 5.72 3.36 3.24 -0.60 -2.34 3.07 -0.97 64.62 37.33 47.12 14.72 19.51 1.40 0.00 -0.50 -4.61 0.74 -7.32 5.93 7.26 -4.61 3.67 -1.18 -2.06 1.33 0.11 0.20 0.18 -4.96 5.44 19.05 22.17 74.06 87.79 36.82 41.82 22.80 23.55 0.00 0.00 -4.92 -4.29 28.98 24.65 8.76 9.05 -8.08 -6.32 -8.58 -5.82 -1.03 -0.88 2.55 2.58 -1.02 -2.20 13.16 11.75 97.52 100.22 Cash Flows From Investing Activities Investments in property, plant, and equipment Acquisitions, net Purchases of investments Sales/Maturities of investments Other investing activities Net cash used for investing activities - 12.19 -13.21 -18.54 -18.06 -25.85 -29.12 -13.19 -8.27 -3.10 -57.65 -1.97 -2.12 -161.53 -219.40 -288.35 -393.12 -305.29 -275.49 145.26 190.80 256.31 365.32 319.86 302.49 -0.19 -1.04 0.45 -0.44 -0.22 -0.45 -41.85 -51.11 -53.22 -103.96 -13.47 -4.69 Cash Flows From Financing Activities Debt issued 23.00 23.73 30.85 98.54 15.96 7.18 Debt repayment -8.64 -3.33 -6.21 -17.60 -22.36 -19.76 Common stock issued 1.35 1.41 1.48 1.72 2.23 2.34 Common stock repurchased - 16.26 -32.10 -35.49 -26.20 -23.82 -26.43 Excess tax benefit from stock based compensation 0.60 1.31 0.00 0.00 0.00 0.00 Dividend paid -19.73 -21.96 -24.46 -26.32 -28.22 -28.70 Other financing activities 1.02 10.76 15.17 -11.45 -18.43 - 11.59 Net cash provided by (used for) financing activities -18.65 -20.18 -18.65 18.68 -74.64 -76.96 Effect of exchange rate changes -0.31 -0.16 -0.15 0.04 0.11 -0.23 Cash at beginning of period Net change in cash Cash at end of period 8.45 10.81 19.26 19.26 -6.83 12.43 12.43 2.03 14.47 14.47 2.56 17.03 17.03 9.52 26.55 15.30 18.34 33.64 Review the provided data on Price-to-Book and Price-to- Cash Flow. Comment on whether these ratios, in Definite integrals can be evaluated approximately using the trapezium rule: /* f(a) dr = tn (ro) + 24 (ra) + - + 2(x2-1) + f(x)], where the interval length h is determined by Nh = IN - 1 and 2 = x + rh. Give a sketch to explain the basis of this approximation Use the trapzium rule with intervals of unit length to evaluate approximately the integral S In de where is an integer (und n > 2). Deduce that nalen ent(9)" and determine, by means of a sketch, whether this approximate value exceeds vi! Show using the trapezium rule thut (21+ 1)!! (2+1)** where the double factorial notation indicates the product of odd integers 1.3.5.. (2+1). Cornelius, Inc. (CRNI) Dividend History Amount ($ per share) Payable Date Dividend Type 12/13/2018 ** Cash Dividend 9/13/2018 Cash Dividend 6/14/2018 Cash Dividend 3/8/2018 Cash Dividend 0.059 0.054 0.054 0.054 12/14/2017 9/14/2017 6/8/2017 3/9/2017 Cash Dividend Cash Dividend Cash Dividend Cash Dividend 0.054 0.050 0.050 0.050 Ex-Dividend Date 2018 11/14/2018 8/15/2018 5/16/2018 2/14/2018 2017 11/15/2017 8/15/2017 5/16/2017 2/14/2017 2016 11/15/2016 8/16/2016 5/17/2016 2/16/2016 2015 11/17/2015 8/18/2015 5/19/2015 2/17/2015 2014 11/18/2014 8/19/2014 5/13/2014 2/18/2014 12/8/2016 9/8/2016 6/9/2016 3/10/2016 Cash Dividend Cash Dividend Cash Dividend Cash Dividend 0.050 0.046 0.046 0.046 12/10/2015 9/10/2015 6/11/2015 3/12/2015 Cash Dividend Cash Dividend Cash Dividend Cash Dividend 0.046 0.040 0.040 0.040 12/11/2014 9/11/2014 6/12/2014 3/13/2014 Cash Dividend Cash Dividend Cash Dividend Cash Dividend 0.040 0.036 0.036 0.036 0.147Step by Step Solution
There are 3 Steps involved in it
Step: 1

Get Instant Access to Expert-Tailored Solutions
See step-by-step solutions with expert insights and AI powered tools for academic success
Step: 2

Step: 3

Ace Your Homework with AI
Get the answers you need in no time with our AI-driven, step-by-step assistance
Get Started


