Answered step by step
Verified Expert Solution
Link Copied!

Question

1 Approved Answer

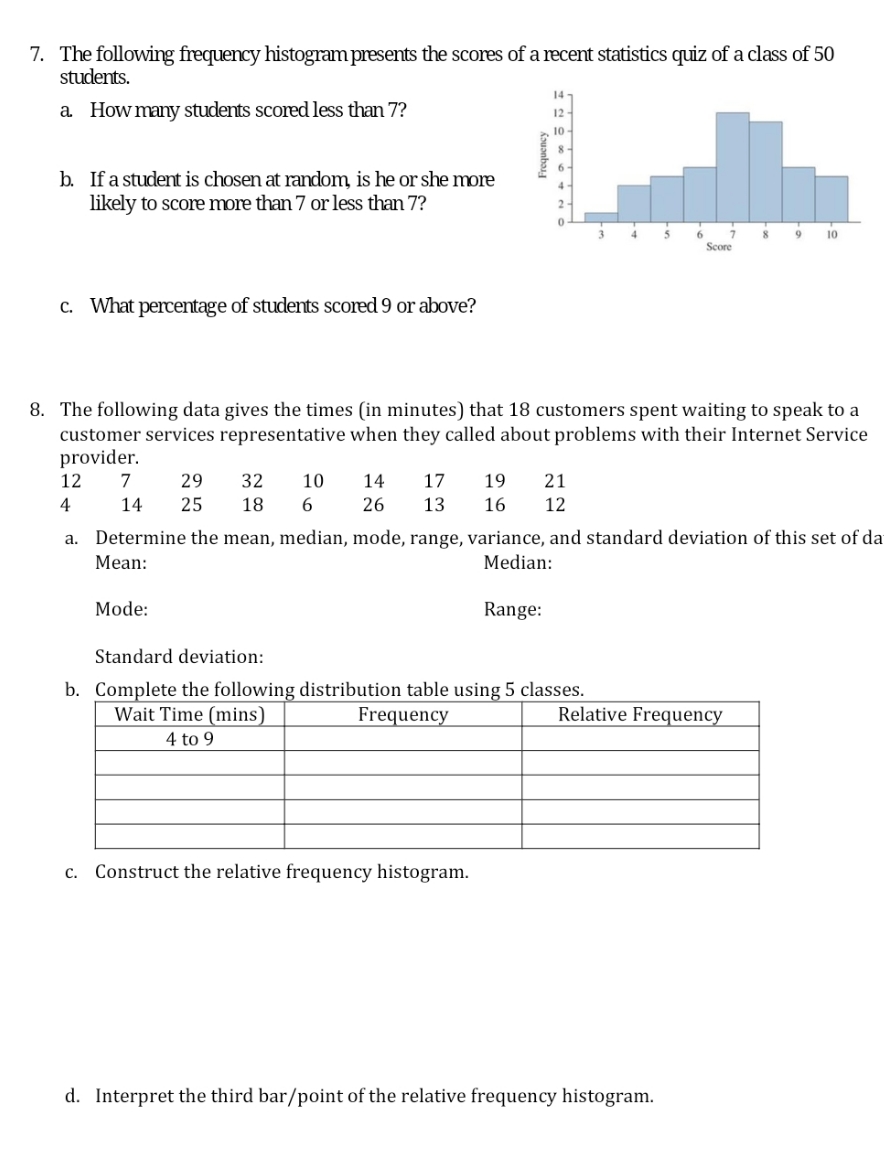
Solve for the correct answers 7. The following frequency histogram presents the scores of a recent statistics quiz of a class of 50 students. a.

Solve for the correct answers

image text in transcribed
7. The following frequency histogram presents the scores of a recent statistics quiz of a class of 50 students. a. How many students scored less than 7? 14 Frequency b. If a student is chosen at random, is he or she more likely to score more than 7 or less than 7? 10 Score C. What percentage of students scored 9 or above? 8. The following data gives the times (in minutes) that 18 customers spent waiting to speak to a customer services representative when they called about problems with their Internet Service provider. 12 7 29 32 10 14 17 19 21 4 14 25 18 6 26 13 16 12 a. Determine the mean, median, mode, range, variance, and standard deviation of this set of da Mean: Median: Mode: Range: Standard deviation: b. Complete the following distribution table using 5 classes. Wait Time (mins) Frequency Relative Frequency 4 to 9 c. Construct the relative frequency histogram. d. Interpret the third bar/point of the relative frequency histogram

Step by Step Solution

There are 3 Steps involved in it

Step: 1

blur-text-image

Get Instant Access to Expert-Tailored Solutions

See step-by-step solutions with expert insights and AI powered tools for academic success

Step: 2

blur-text-image

Step: 3

blur-text-image

Ace Your Homework with AI

Get the answers you need in no time with our AI-driven, step-by-step assistance

Get Started

Recommended Textbook for

Differential Equations and Linear Algebra

Authors: Jerry Farlow, James E. Hall, Jean Marie McDill, Beverly H. West

2nd edition

131860615, 978-0131860612

More Books

Students also viewed these Mathematics questions