Answered step by step
Verified Expert Solution
Question
1 Approved Answer
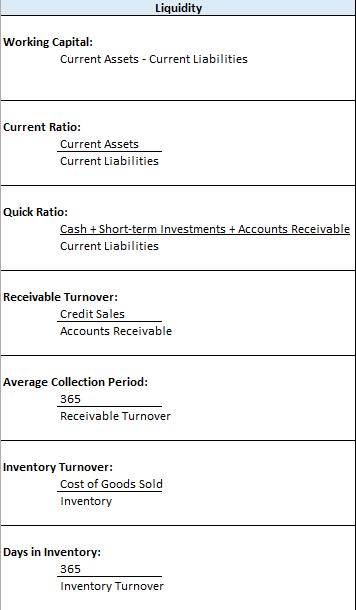
Working Capital: Current Assets - Current Liabilities Current Ratio: Current Assets Current Liabilities Quick Ratio: Liquidity Cash + Short-term Investments + Accounts Receivable Current


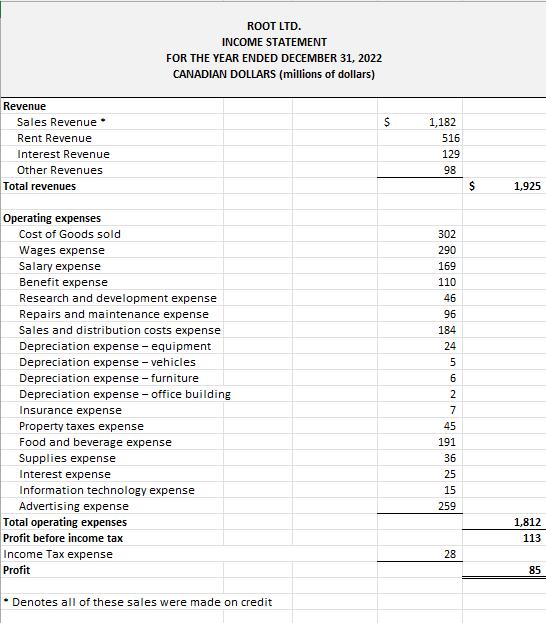
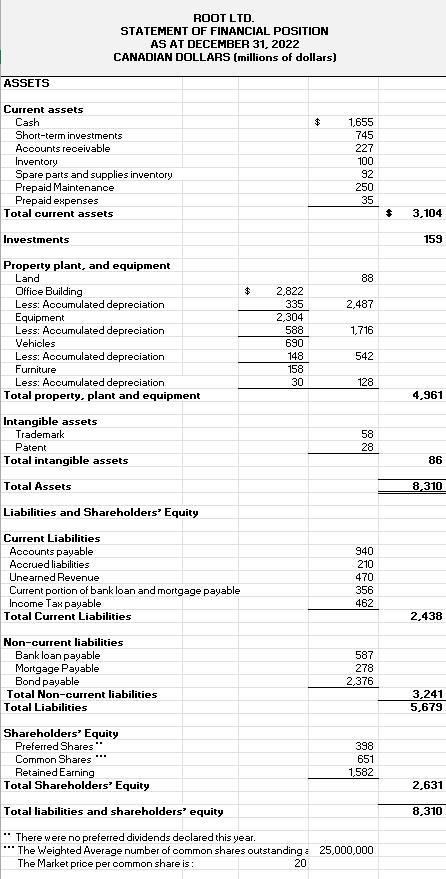
Working Capital: Current Assets - Current Liabilities Current Ratio: Current Assets Current Liabilities Quick Ratio: Liquidity Cash + Short-term Investments + Accounts Receivable Current Liabilities Receivable Turnover: Credit Sales Accounts Receivable Average Collection Period: 365 Receivable Turnover Inventory Turnover: Cost of Goods Sold Inventory Days in Inventory: 365 Inventory Turnover Revenue Sales Revenue. Rent Revenue Interest Revenue Other Revenues Total revenues Operating expenses Cost of Goods sold FOR THE YEAR ENDED DECEMBER 31, 2022 CANADIAN DOLLARS (millions of dollars) Wages expense Salary expense Benefit expense Research and development expense ROOT LTD. INCOME STATEMENT Repairs and maintenance expense Sales and distribution costs expense Depreciation expense - equipment Depreciation expense - vehicles Depreciation expense - furniture Depreciation expense - office building Insurance expense Property taxes expense Food and beverage expense Supplies expense Interest expense Information technology expense Advertising expense Total operating expenses Profit before income tax Income Tax expense Profit . Denotes all of these sales were made on credit $ 1,182 516 129 98 302 290 169 110 46 96 184 24 NGU 7 45 191 36 25 15 259 28 $ 1,925 1,812 113 85 ASSETS Current assets Cash ROOT LTD. STATEMENT OF FINANCIAL POSITION AS AT DECEMBER 31, 2022 CANADIAN DOLLARS (millions of dollars) Short-term investments Accounts receivable Inventory Spare parts and supplies inventory Prepaid Maintenance Prepaid expenses Total current assets Investments Property plant, and equipment Land Office Building Less: Accumulated depreciation Equipment Less: Accumulated depreciation Vehicles Less: Accumulated depreciation Furniture Less: Accumulated depreciation Total property, plant and equipment Intangible assets Trademark Patent Total intangible assets Total Assets Liabilities and Shareholders' Equity Current Liabilities Accounts payable Accrued liabilities Unearned Revenue Current portion of bank loan and mortgage payable Income Tax payable Total Current Liabilities Non-current liabilities Bank loan payable Mortgage Payable Bond payable Total Non-current liabilities Total Liabilities Shareholders' Equity Preferred Shares" Common Shares $ 2,822 335 2,304 588 690 148 158 30 Retained Earning Total Shareholders' Equity Total liabilities and shareholders' equity There were no preferred dividends declared this year. *** The Weighted Average number of common shares outstanding The Market price per common share is: 20 $ 1,655 745 227 100 92 250 35 88 2,487 1,716 542 128 58 28 940 210 470 356 462 587 278 2,376 398 651 1,582 25,000,000 $ 3,104 159 4,961 86 8,310 2,438 3,241 5,679 2,631 8,310
Step by Step Solution
★★★★★
3.51 Rating (158 Votes )
There are 3 Steps involved in it
Step: 1
CALCULATIONS Working Capital Total Current Assets Total Current Liabilities 1655 745 22...
Get Instant Access to Expert-Tailored Solutions
See step-by-step solutions with expert insights and AI powered tools for academic success
Step: 2

Step: 3

Ace Your Homework with AI
Get the answers you need in no time with our AI-driven, step-by-step assistance
Get Started


