

Question: Solve for x in sin x tan x + tan x - 2sin x + cos x = 0 for 0 x 2 rads. 2.Paolina
- Solve for x in sin x tan x + tan x - 2sin x + cos x = 0 for 0 x 2 rads.
2.Paolina has is an artist that can create 18 math paintings per day. Someone is willing to pay Paolina $35/paints plus $1000 bonus.
a. Find an algebraic expression that relates the number of paintings Paolina paints to the number of days she paints.
b. Find and algebraic expression that relates the revenues based on the number of paintings sold.
c. Find a composite function that relates the number of days Paolina paints with the revenue she can generate.
- d. How much will Paolina make if she paints for 5 days?
3.
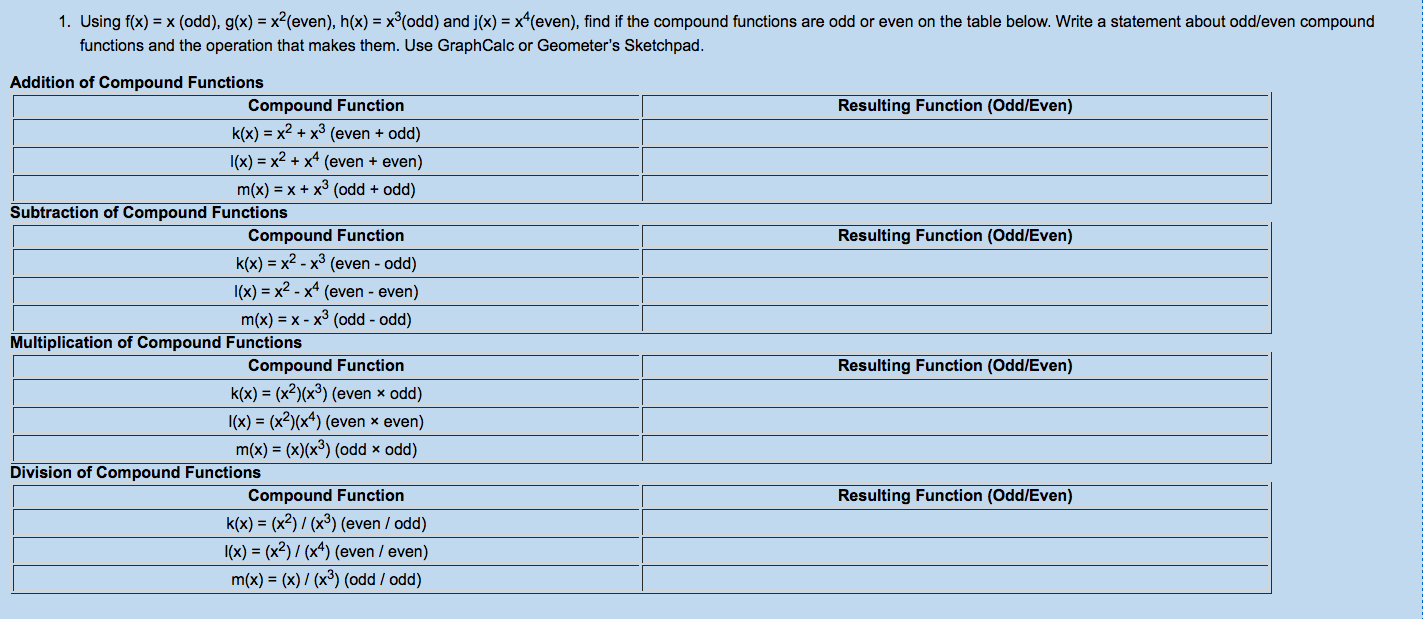
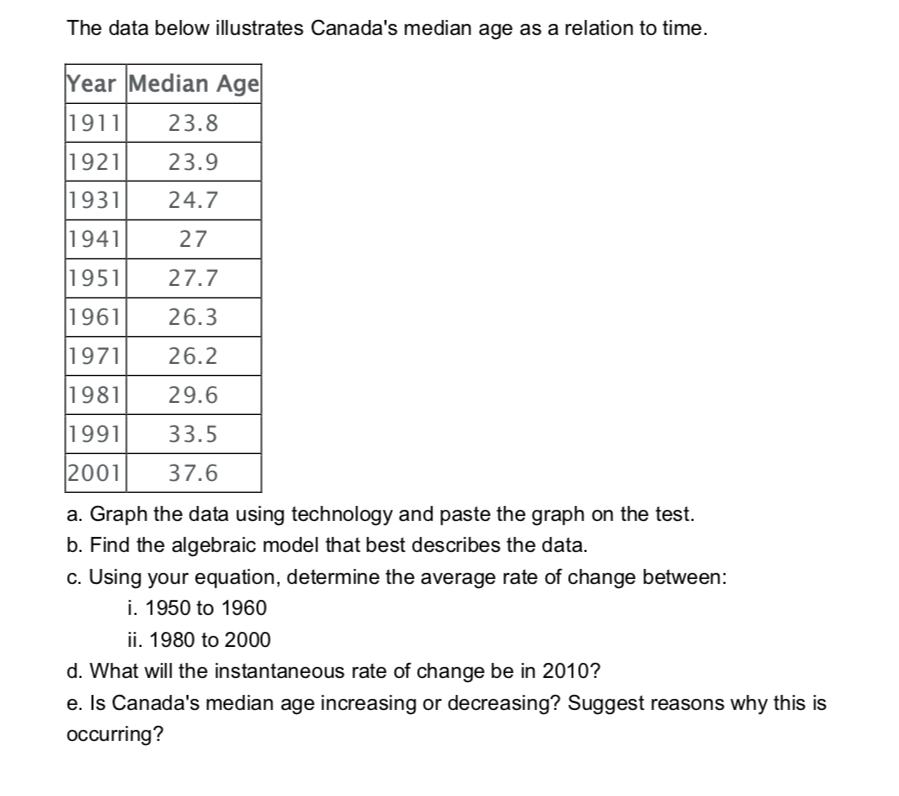
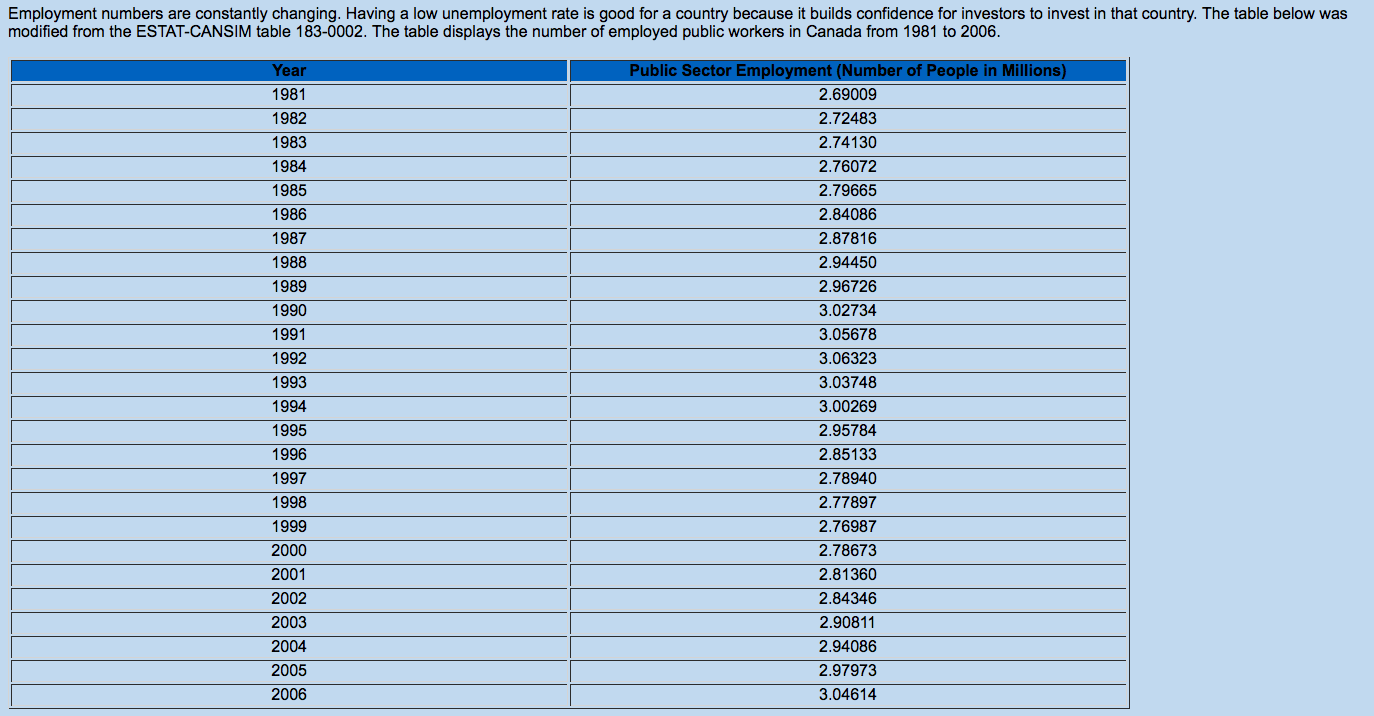
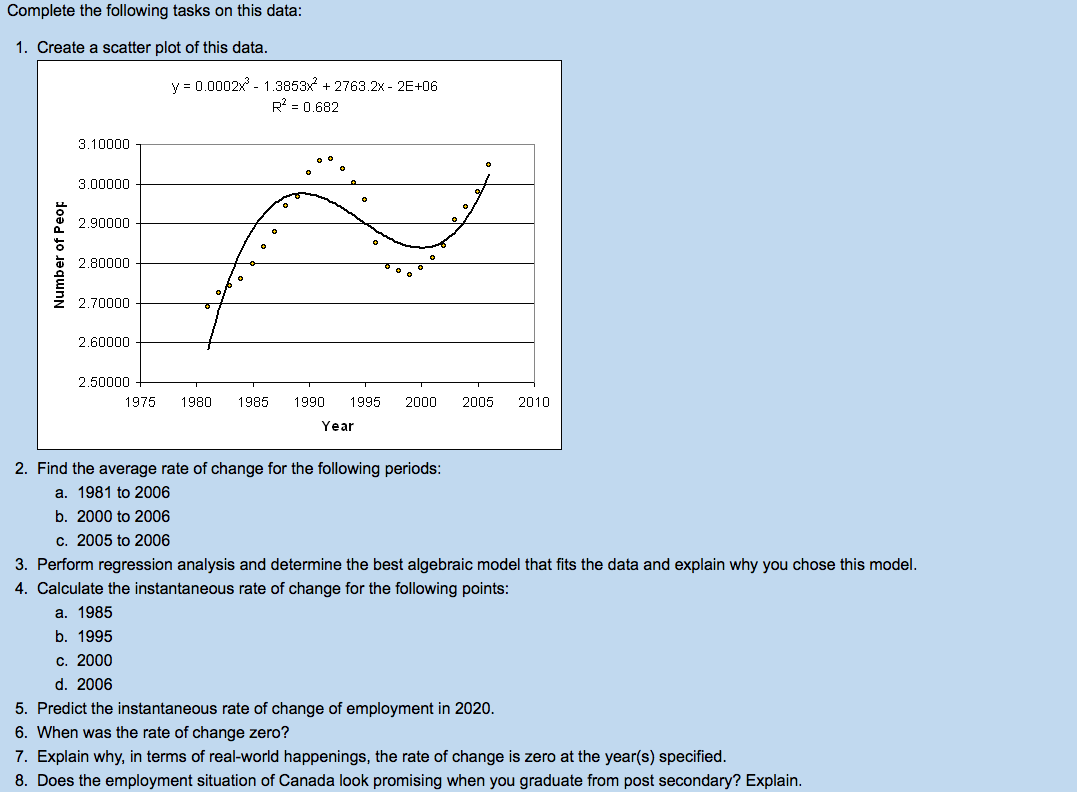
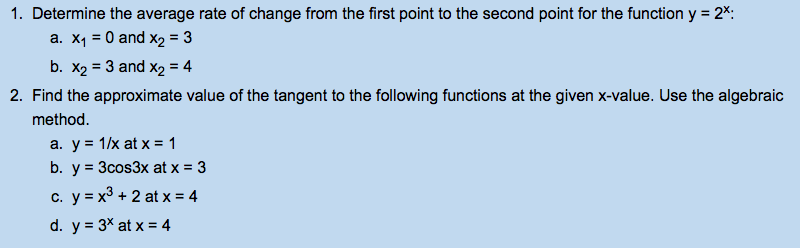
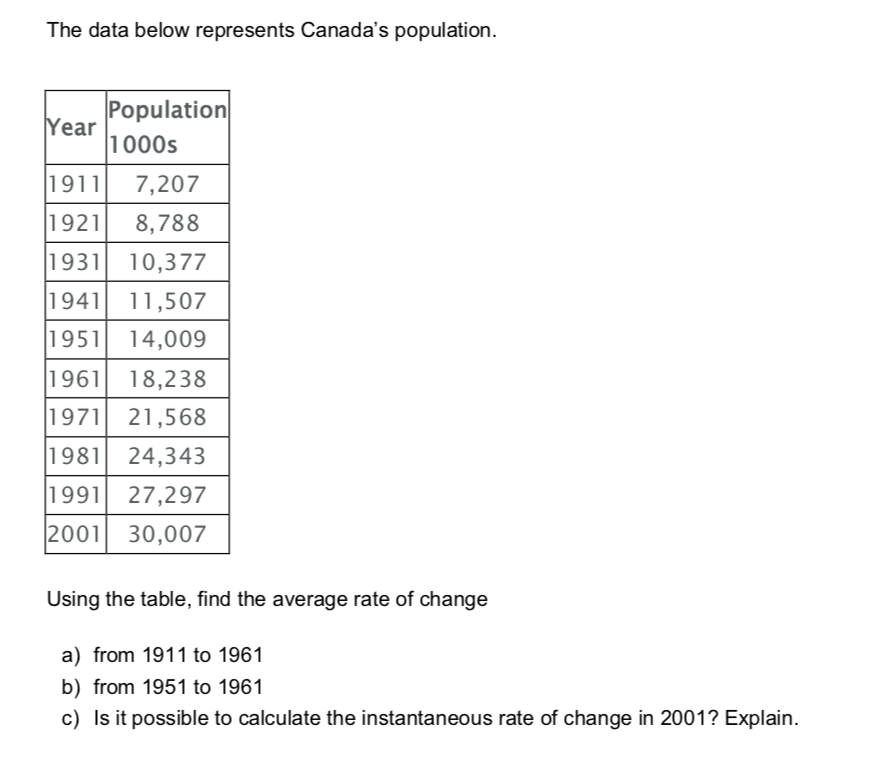
1. Using f(x) = x (odd), g(x) = x2(even), h(x) = x"(odd) and j(x) = x*(even), find if the compound functions are odd or even on the table below. Write a statement about odd/even compound functions and the operation that makes them. Use GraphCalc or Geometer's Sketchpad. Addition of Compound Functions Compound Function Resulting Function (Odd/Even) k(x) = x2 + x3 (even + odd) 1(x) = x2 + x4(even + even) m(x) = x + x (odd + odd) Subtraction of Compound Functions Compound Function Resulting Function (Odd/Even) k(x) = x2 - x3 (even - odd) 1(x) = x2 - x4 (even - even) m(x) = x - x (odd - odd) Multiplication of Compound Functions Compound Function Resulting Function (Odd/Even) k(x) = (x2)(x3) (even x odd) 1(x) = (x2)(x4) (even x even) m(x) = (x)(x3) (odd x odd) Division of Compound Functions Compound Function Resulting Function (Odd/Even) k(x) = (x2) / (x3) (even / odd) 1(x) = (x2) / (x4) (even / even) m(x) = (x) / (x3) (odd / odd)T 3 data below illustrates Canada's median age as a relation to time. Median Age 23.8 23.9 24.7 _| LO N _| LDLD 3-50.: l| 2?.7' 26.3 26.2 29.6 33.5 3?.6 a. Graph the data using technology and paste the graph on the test. b. Find the algebraic model that best describes the data. c. Using your equation, determine the average rate of change between: i. 1950 to 1960 ii. 1980 to 2000 d. What will the instantaneous rate of change be in 2010? e. ls Canada's median age increasing or decreasing? Suggest reasons why this is occurring? | Lo "4 | l '43 on l _ _ _ _ 1951- _ _ _ _ _ N O D l Employment numbers are constantly changing. Having a low unemployment rate is good for a country because it builds confidence for investors to invest in that country. The table below was modified from the ESTAT-CANSIM table 183-0002. The table displays the number of employed public workers in Canada from 1981 to 2006. Year Public Sector Employment (Number of People in Millions) 1981 2.69009 1982 2.72483 1983 2.74130 1984 2.76072 1985 2.79665 1986 2.84086 1987 2.87816 1988 2.94450 1989 2.96726 1990 3.02734 1991 3.05678 1992 3.06323 1993 3.03748 1994 3.00269 1995 2.95784 1996 2.85133 1997 2.78940 1998 2.77897 1999 2.76987 2000 2.78673 2001 2.81360 2002 2.84346 2003 2.90811 2004 2.94086 2005 2.97973 2006 3.04614Complete the following tasks on this data: 1. Create a scatter plot of this data. y = 0.0002x" - 1.3853x7 + 2763.2x - 26+06 R' = 0.682 3.10000 3.00000 Number of Peop 2.90000 2.80000 2.70000 2.60000 2.50000 + 1975 1980 1985 1990 1995 2000 2005 2010 Year 2. Find the average rate of change for the following periods: a. 1981 to 2006 b. 2000 to 2006 c. 2005 to 2006 3. Perform regression analysis and determine the best algebraic model that fits the data and explain why you chose this model. 4. Calculate the instantaneous rate of change for the following points: a. 1985 b. 1995 c. 2000 d. 2006 5. Predict the instantaneous rate of change of employment in 2020. 6. When was the rate of change zero? 7. Explain why, in terms of real-world happenings, the rate of change is zero at the year(s) specified. 8. Does the employment situation of Canada look promising when you graduate from post secondary? Explain.1. Determine the average rate of change from the first point to the second point for the function y = 2*: a. X, = 0 and x2 = 3 b. X2 = 3 and X2 = 4 2. Find the approximate value of the tangent to the following functions at the given x-value. Use the algebraic method. a. y = 1/x at x = 1 b. y = 3cos3x at x = 3 c. y= x3 + 2 at x = 4 d. y = 3* at x = 4The data below represents Canada's population. Year Population 1000s 1911 7,207 1921 8,788 1931 10,377 1941 11,507 1951 14,009 1961 18,238 1971 21,568 1981 24,343 1991 27,297 2001 30,007 Using the table, find the average rate of change a) from 1911 to 1961 b) from 1951 to 1961 c) Is it possible to calculate the instantaneous rate of change in 2001? Explain
Step by Step Solution
There are 3 Steps involved in it

Get step-by-step solutions from verified subject matter experts