

Question: solve in 50 mins i will give thumb up Question 3 [Total: 30] Let (X4) be a random walk of the form X, = Xt-1
![[Total: 30] Let (X4) be a random walk of the form X,](https://dsd5zvtm8ll6.cloudfront.net/si.experts.images/questions/2024/09/66f52ccf3c9c0_82266f52cceb8bf1.jpg)
solve in 50 mins i will give thumb up
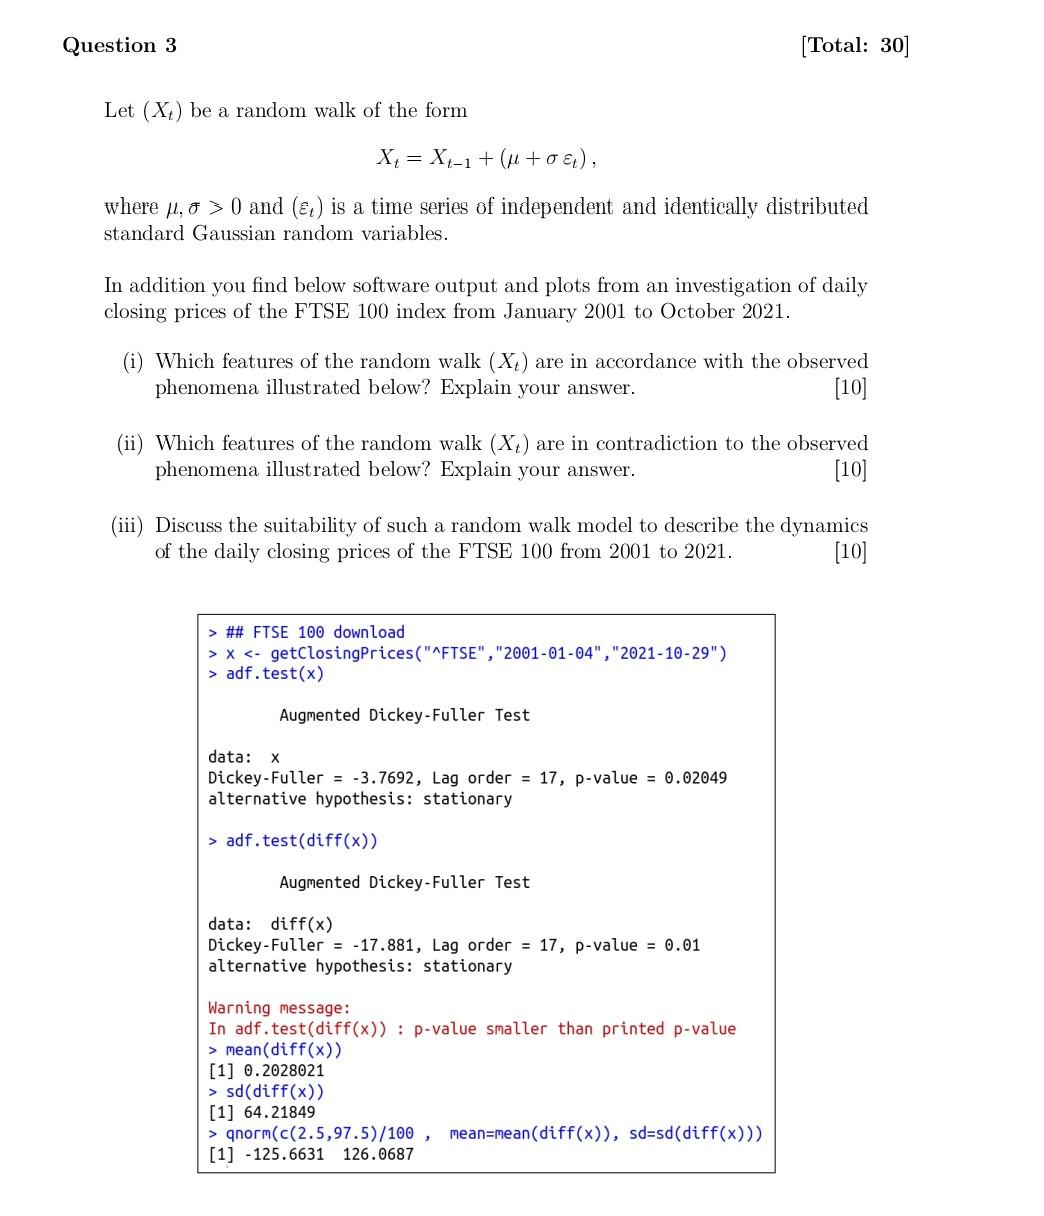
Question 3 [Total: 30] Let (X4) be a random walk of the form X, = Xt-1 + (n +0), where pl, o > 0 and (t) is a time series of independent and identically distributed standard Gaussian random variables. In addition you find below software output and plots from an investigation of daily closing prices of the FTSE 100 index from January 2001 to October 2021. (i) Which features of the random walk (X4) are in accordance with the observed phenomena illustrated below? Explain your answer. [10] (ii) Which features of the random walk (X) are in contradiction to the observed phenomena illustrated below? Explain your answer. [10] a (iii) Discuss the suitability of such a random walk model to describe the dynamics of the daily closing prices of the FTSE 100 from 2001 to 2021. [10] > ## FTSE 100 download > X adf.test(x) Augmented Dickey-Fuller Test data: X Dickey-Fuller = -3.7692, Lag order = 17, p-value = 0.02049 alternative hypothesis: stationary > adf.test(diff(x)) Augmented Dickey-Fuller Test data: diff(x) Dickey-Fuller = -17.881, Lag order = 17, p-value = 0.01 alternative hypothesis: stationary Warning message: In adf.test(diff(x)) : p-value smaller than printed p-value > mean(diff(x)) [1] 0.2028021 > sd(diff(x)) [1] 64.21849 > qnorm(C(2.5,97.5)/100, mean=mean(diff(x)), sd=sd(diff(x)) [1] -125.6631 126.0687 FTSE 100 daily closing prices FTSE 100 price differences 8000 200 6000 diff(x) -200 4000 009- 2000 2005 2010 2015 2020 2000 2005 2010 2015 2020 Normal QQ plot (price differences) Sample Quantiles -2000 200 600 1 -4 -2 0 2 4 Theoretical Quantiles Series diff(x) Series abs(diff(x)) 0.8 ACF ACF 0.0 0.2 0.4 0.6 0.8 1.0 0.4 0.0 T 0 10 20 30 0 0 10 20 30 Question 3 [Total: 30] Let (X4) be a random walk of the form X, = Xt-1 + (n +0), where pl, o > 0 and (t) is a time series of independent and identically distributed standard Gaussian random variables. In addition you find below software output and plots from an investigation of daily closing prices of the FTSE 100 index from January 2001 to October 2021. (i) Which features of the random walk (X4) are in accordance with the observed phenomena illustrated below? Explain your answer. [10] (ii) Which features of the random walk (X) are in contradiction to the observed phenomena illustrated below? Explain your answer. [10] a (iii) Discuss the suitability of such a random walk model to describe the dynamics of the daily closing prices of the FTSE 100 from 2001 to 2021. [10] > ## FTSE 100 download > X adf.test(x) Augmented Dickey-Fuller Test data: X Dickey-Fuller = -3.7692, Lag order = 17, p-value = 0.02049 alternative hypothesis: stationary > adf.test(diff(x)) Augmented Dickey-Fuller Test data: diff(x) Dickey-Fuller = -17.881, Lag order = 17, p-value = 0.01 alternative hypothesis: stationary Warning message: In adf.test(diff(x)) : p-value smaller than printed p-value > mean(diff(x)) [1] 0.2028021 > sd(diff(x)) [1] 64.21849 > qnorm(C(2.5,97.5)/100, mean=mean(diff(x)), sd=sd(diff(x)) [1] -125.6631 126.0687 FTSE 100 daily closing prices FTSE 100 price differences 8000 200 6000 diff(x) -200 4000 009- 2000 2005 2010 2015 2020 2000 2005 2010 2015 2020 Normal QQ plot (price differences) Sample Quantiles -2000 200 600 1 -4 -2 0 2 4 Theoretical Quantiles Series diff(x) Series abs(diff(x)) 0.8 ACF ACF 0.0 0.2 0.4 0.6 0.8 1.0 0.4 0.0 T 0 10 20 30 0 0 10 20 30
Step by Step Solution
There are 3 Steps involved in it

Get step-by-step solutions from verified subject matter experts