

Answered step by step
Verified Expert Solution
Question
1 Approved Answer
solve it 7. This example uses the Body Fat Example Data, a standard well known data set with three predictors (X1: Skin fold thickness; X2:
solve it
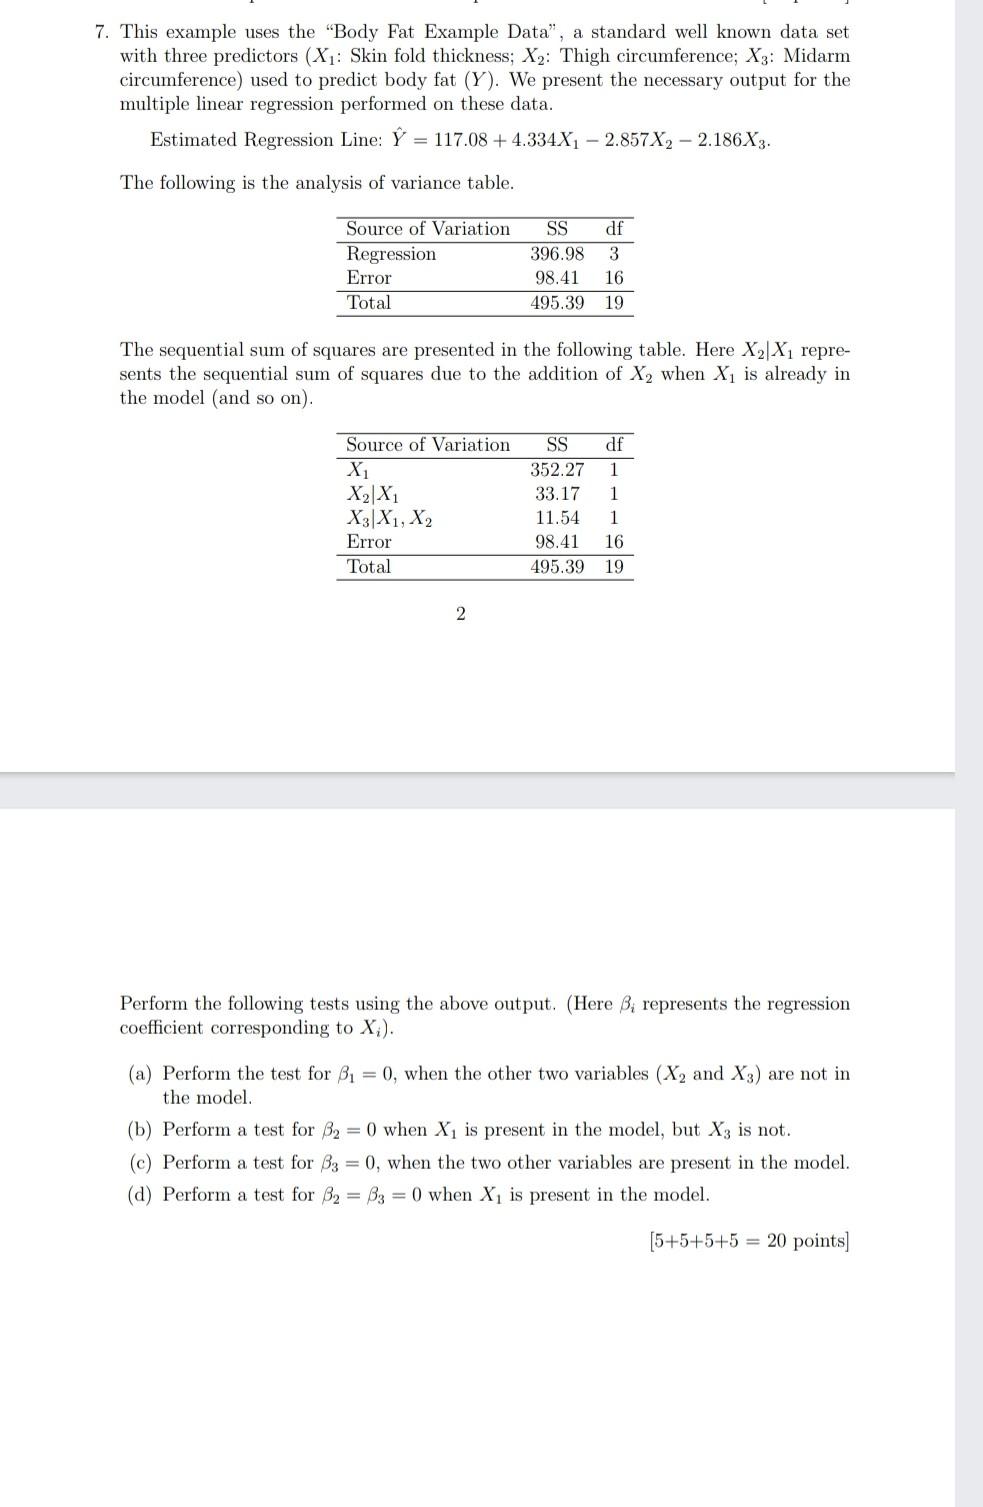
7. This example uses the "Body Fat Example Data", a standard well known data set with three predictors (X1: Skin fold thickness; X2: Thigh circumference; X3: Midarm circumference) used to predict body fat (Y). We present the necessary output for the multiple linear regression performed on these data. Estimated Regression Line: Y = 117.08 + 4.334X1 - 2.857X2 - 2.186X3. The following is the analysis of variance table. Source of Variation Regression Error Total SS 396.98 98.41 495.39 df 3 16 19 The sequential sum of squares are presented in the following table. Here X2 X1 repre- sents the sequential sum of squares due to the addition of X2 when X1 is already in the model (and so on). Source of Variation , X2 X X3 X1, X2 Error Total SS 352.27 33.17 11.54 98.41 495.39 df 1 1 1 16 19 2 Perform the following tests using the above output. (Here B, represents the regression coefficient corresponding to X/). (a) Perform the test for B1 = 0, when the other two variables (X, and X3) are not in the model. (b) Perform a test for B2 = 0 when Xi is present in the model, but X3 is not. (c) Perform a test for B3 = 0, when the two other variables are present in the model. (d) Perform a test for B2 = B3 = 0 when Xis present in the model. [5+5+5+5 = 20 points) 7. This example uses the "Body Fat Example Data", a standard well known data set with three predictors (X1: Skin fold thickness; X2: Thigh circumference; X3: Midarm circumference) used to predict body fat (Y). We present the necessary output for the multiple linear regression performed on these data. Estimated Regression Line: Y = 117.08 + 4.334X1 - 2.857X2 - 2.186X3. The following is the analysis of variance table. Source of Variation Regression Error Total SS 396.98 98.41 495.39 df 3 16 19 The sequential sum of squares are presented in the following table. Here X2 X1 repre- sents the sequential sum of squares due to the addition of X2 when X1 is already in the model (and so on). Source of Variation , X2 X X3 X1, X2 Error Total SS 352.27 33.17 11.54 98.41 495.39 df 1 1 1 16 19 2 Perform the following tests using the above output. (Here B, represents the regression coefficient corresponding to X/). (a) Perform the test for B1 = 0, when the other two variables (X, and X3) are not in the model. (b) Perform a test for B2 = 0 when Xi is present in the model, but X3 is not. (c) Perform a test for B3 = 0, when the two other variables are present in the model. (d) Perform a test for B2 = B3 = 0 when Xis present in the model. [5+5+5+5 = 20 points)Step by Step Solution
There are 3 Steps involved in it
Step: 1

Get Instant Access to Expert-Tailored Solutions
See step-by-step solutions with expert insights and AI powered tools for academic success
Step: 2

Step: 3
Ace Your Homework with AI
Get the answers you need in no time with our AI-driven, step-by-step assistance
Get Started
How Charts Can Help You In The Stock Market
Authors: William Jiler
1st Edition
1265641218, 978-1265641214