Answered step by step
Verified Expert Solution
Link Copied!

Question

1 Approved Answer

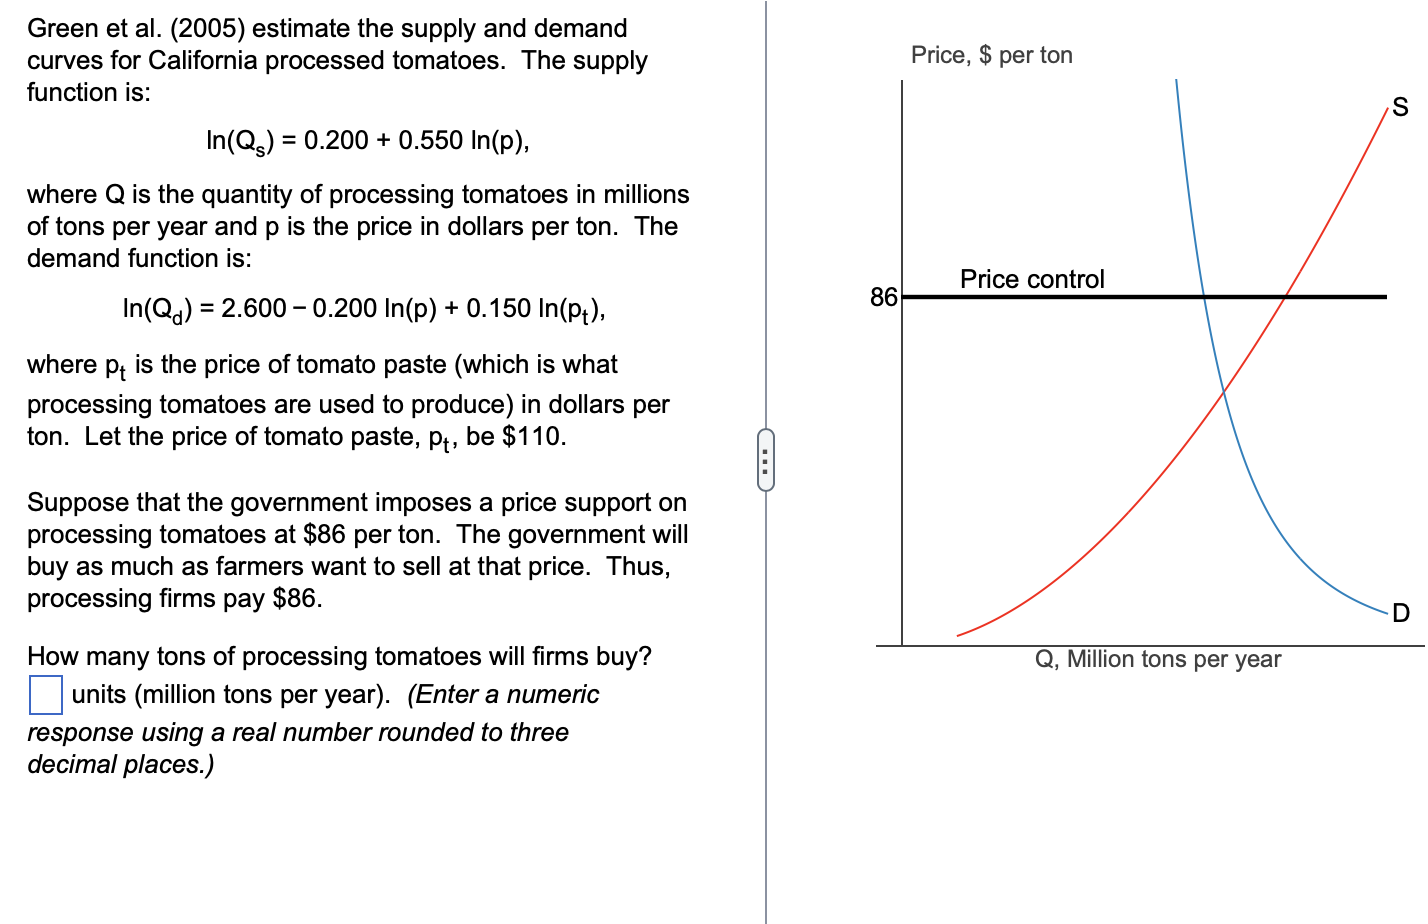
Solve it correctly please. I will rate accordingly with multiple votes. Ty-ped answer please. Green et al. (2005) estimate the supply and demand curves for

Solve it correctly please. I will rate accordingly with multiple votes. Ty-ped answer please.

image text in transcribed
Green et al. (2005) estimate the supply and demand curves for California processed tomatoes. The supply Price, $ per ton function is: S In(Qs) = 0.200 + 0.550 In(p), where Q is the quantity of processing tomatoes in millions of tons per year and p is the price in dollars per ton. The demand function is: Price control In(Q) = 2.600 - 0.200 In(p) + 0.150 In(Pt), 86 where pt is the price of tomato paste (which is what processing tomatoes are used to produce) in dollars per ton. Let the price of tomato paste, pt, be $110. Suppose that the government imposes a price support on processing tomatoes at $86 per ton. The government will buy as much as farmers want to sell at that price. Thus, processing firms pay $86. D How many tons of processing tomatoes will firms buy? Q, Million tons per year units (million tons per year). (Enter a numeric response using a real number rounded to three decimal places.)

Step by Step Solution

There are 3 Steps involved in it

Step: 1

blur-text-image

Get Instant Access to Expert-Tailored Solutions

See step-by-step solutions with expert insights and AI powered tools for academic success

Step: 2

blur-text-image

Step: 3

blur-text-image

Ace Your Homework with AI

Get the answers you need in no time with our AI-driven, step-by-step assistance

Get Started

Recommended Textbook for

The Strictures Of Inheritance The Dutch Economy In The Nineteenth Century

Authors: Jan Luiten Van Zanden, Arthur Van Riel, Ian Cressie

1st Edition

0691229309, 9780691229300

More Books

Students also viewed these Economics questions

Question

What role do hormone levels play in mood?

Answered: 1 week ago