

Question
Solve the following Monte-Carlo simulation problem both with Excel data tables and @Risk. Include all your answers directly in your Excel file using text boxes
Solve the following Monte-Carlo simulation problem both with Excel data tables and @Risk. Include all your answers directly in your Excel file using text boxes or comment boxes. Please show formulas used within excel.
NCAA Sweatshirt Problem
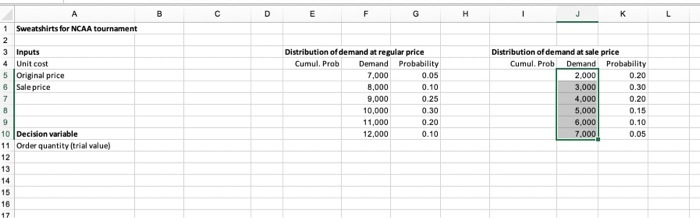
An enterprising OU student is trying to decide how many sweatshirts to print for an upcoming NCAA Basketball Tournament game. The final four teams have emerged from the quarterfinal round, and there is a week left until the semi-finals, which are then followed by the finals a few days later. Each sweatshirt costs $10 to produce and sells for $25. However, in 3 weeks, any leftover sweatshirts will be put on sale for half price, $12.50. The student assumes that the demand for her sweatshirts during the next three weeks has the distribution shown in the file NCAASweatshirts-shell.xlsx in F5:G10. The residual demand, after the sweatshirts have been put on sale, has the distribution also shown in the same file in J5:K10. The student, being a profit maximizer, realizes that every sweatshirt sold, even at the sale price, makes a profit. However, she also realizes that any sweatshirts printed and still unsold (even at the sale price) must be given away, resulting in a loss of $10 per discarded shirt. Your job is:
1) Build an Excel based Monte-Carlo simulation model that will produce a probability distribution of profit for a given number of sweatshirts printed. Your simulation model should do 1000 replications.
For your base model,
2) Set the number of sweatshirts printed in your model to 10000. Run your model and find the mean and standard deviation of profit as well as the 5th and 95th percentiles of profit.
3) Construct a 95% confidence interval on the mean profit.
4) Now use your model to explore different numbers of printing quantities and find the:
a. Quantity that maximizes mean profit
b. Quantity that maximizes 5th percentile of profit
c. Quantity that maximizes 95th percentile of profit
d. Do these quantities differ?
Step by Step Solution
There are 3 Steps involved in it
Step: 1

Get Instant Access to Expert-Tailored Solutions
See step-by-step solutions with expert insights and AI powered tools for academic success
Step: 2

Step: 3
Ace Your Homework with AI
Get the answers you need in no time with our AI-driven, step-by-step assistance
Get Started
Information Technology Control And Audit
Authors: Sandra Senft, Frederick Gallegos, Aleksandra Davis
4th Edition
1439893209, 978-1439893203