Solve the following question
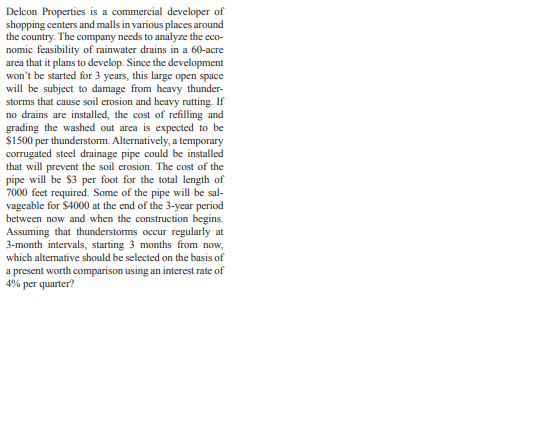
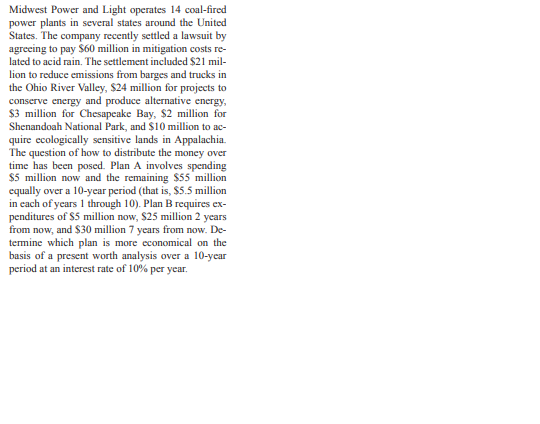
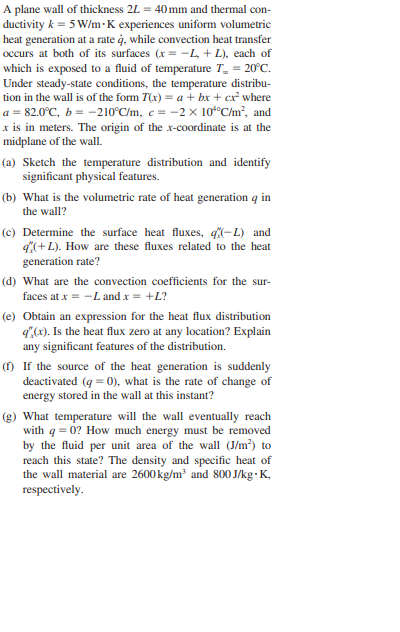
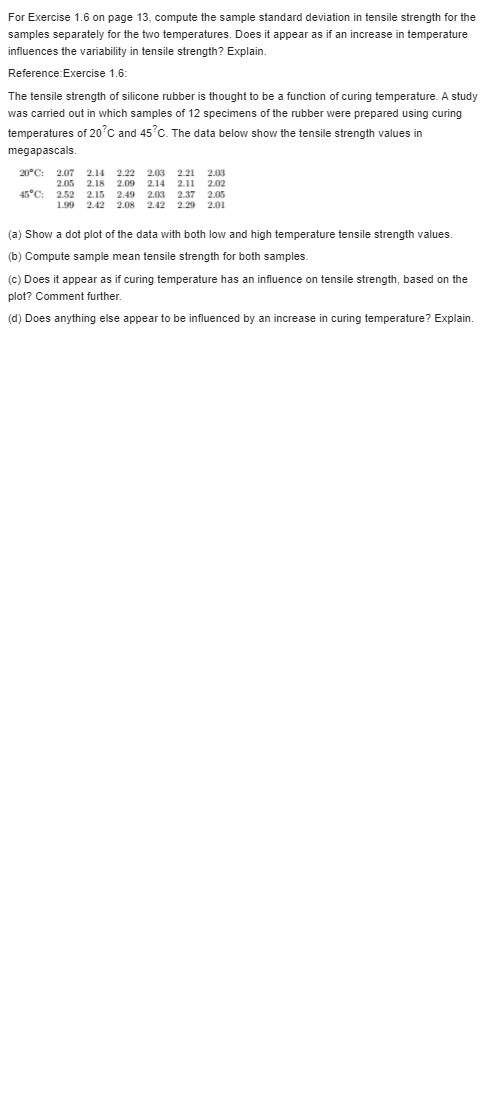
Exercise 1.3 on page 13 showed tensile strength data for two samples, one in which specimens were exposed to an aging process and one in which there was no aging of the specimens. (a) Calculate the sample variance as well as standard deviation in tensile strength for both samples. (b) Does there appear to be any evidence that aging affects the variability in tensile strength? (See also the plot for Exercise 1.3 on page 13.) Reference: Exercise 1.3: A certain polymer is used for evacuation systems for aircraft. It is important that the polymer be resistant to the aging process. Twenty specimens of the polymer were used in an experiment. Ten were assigned randomly to be exposed to an accelerated batch aging process that involved exposure to high temperatures for 10 days. Measurements of tensile strength of the specimens were made, and the following data were recorded on tensile strength in psi: No aging: 227 222 218 217 225 218 216 229 228 221 Aging: 219 214 215 211 209 218 203 204 201 205 (a) Do a dot plot of the data. (b) From your plot, does it appear as if the aging process has had an effect on the tensile strength of thispolymer? Explain. (c) Calculate the sample mean tensile strength of the two samples. (d) Calculate the median for both. Discuss the similarity or lack of similarity between the mean andmedian of each group.The following measurements were recorded for the drying time, in hours, of a certain brand of latex paint. 3.4 2.5 4.8 2.9 3.6 2.8 3.3 5.6 3.7 2.8 4.4 4.0 5.2 3.0 4.8 Assume that the measurements are a simple random sample. (a) What is the sample size for the above sample? (b) Calculate the sample mean for these data. (c) Calculate the sample median. (d) Plot the data by way of a dot plot. (e) Compute the 20% trimmed mean for the above data set. (f) Is the sample mean for these data more or less descriptive as a center of location than the trimmed mean?Delcon Properties is a commercial developer of shopping centers and malls in various places around the country. The company needs to analyze the eco- nomic feasibility of rainwater drains in a 60-acre area that it plans to develop. Since the development won't be started for 3 years, this large open space will be subject to damage from heavy thunder- storms that cause soil erosion and heavy rutting If no drains are installed, the cost of refilling and grading the washed out area is expected to be $1500 per thunderstorm. Alternatively, a temporary corrugated steel drainage pipe could be installed that will prevent the soil erosion. The cost of the pipe will be $3 per foot for the total length of 7000 feet required. Some of the pipe will be sal- vageable for $4000 at the end of the 3-year period between now and when the construction begins. Assuming that thunderstorms occur regularly at 3-month intervals, starting 3 months from now, which alternative should be selected on the basis of a present worth comparison using an interest rate of 4% per quarter?Midwest Power and Light operates 14 coal-fired power plants in several states around the United States. The company recently settled a lawsuit by agreeing to pay $60 million in mitigation costs re- lated to acid rain. The settlement included $21 mil- lion to reduce emissions from barges and trucks in the Ohio River Valley, $24 million for projects to conserve energy and produce alternative energy, $3 million for Chesapeake Bay, $2 million for Shenandoah National Park, and $10 million to ac- quire ecologically sensitive lands in Appalachia. The question of how to distribute the money over time has been posed. Plan A involves spending $5 million now and the remaining $55 million equally over a 10-year period (that is, $5.5 million in each of years 1 through 10). Plan B requires ex- penditures of $5 million now, $25 million 2 years from now, and $30 million 7 years from now. De- termine which plan is more economical on the basis of a present worth analysis over a 10-year period at an interest rate of 10% per year.A plane wall of thickness 24 = 40 mm and thermal con- ductivity & = 5 W/m . K experiences uniform volumetric heat generation at a rate q, while convection heat transfer occurs at both of its surfaces (x = -L, + L), each of which is exposed to a fluid of temperature Tz = 20"C. Under steady-state conditions, the temperature distribu- tion in the wall is of the form 7(x) = a + by + ex where a = 82.0"C, b = -210"C/m, c = -2 x 10"C/m, and x is in meters. The origin of the x-coordinate is at the midplane of the wall. (a) Sketch the temperature distribution and identify significant physical features. (b) What is the volumetric rate of heat generation q in the wall? (c) Determine the surface heat fluxes, 4(-L) and 4,(+ L). How are these fluxes related to the heat generation rate? (d) What are the convection coefficients for the sur- faces at x = -L and x = +L? (e) Obtain an expression for the heat flux distribution q"(x). Is the heat flux zero at any location? Explain any significant features of the distribution. (f) If the source of the heat generation is suddenly deactivated (q = 0), what is the rate of change of energy stored in the wall at this instant? (g) What temperature will the wall eventually reach with q = 0? How much energy must be removed by the fluid per unit area of the wall (J/m ) to reach this state? The density and specific heat of the wall material are 2600 kg/m3 and 800 J/kg - K. respectively.For Exercise 1.6 on page 13, compute the sample standard deviation in tensile strength for the samples separately for the two temperatures. Does it appear as if an increase in temperature influences the variability in tensile strength? Explain. Reference: Exercise 1.6: The tensile strength of silicone rubber is thought to be a function of curing temperature. A study was carried out in which samples of 12 specimens of the rubber were prepared using curing temperatures of 20 C and 45 C. The data below show the tensile strength values in megapascals. 20 C: 2.07 2.14 2.22 2.03 2.21 2.03 2.05 2.18 2.09 2.14 2.11 2.02 45"C: 2.52 2.15 2.49 2.03 2.37 2.05 1.09 2.42 2.08 2.42 2.29 2.01 (a) Show a dot plot of the data with both low and high temperature tensile strength values. (b) Compute sample mean tensile strength for both samples. (c) Does it appear as if curing temperature has an influence on tensile strength, based on the plot? Comment further. (d) Does anything else appear to be influenced by an increase in curing temperature? Explain