Solve the question
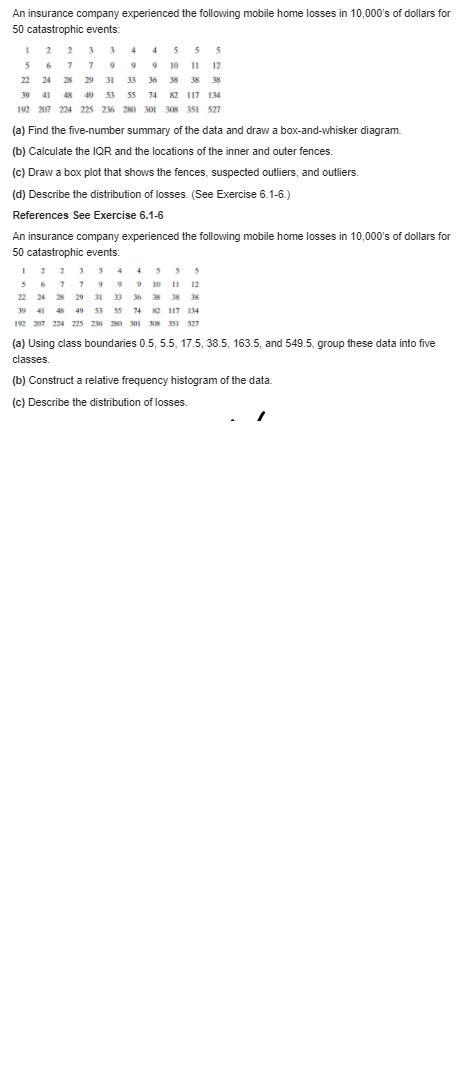
Compute the sample variance and standard deviation for the water absorbency data of Exercise 1.2 on page 13. Reference: Exercise 1.2 According to the journal Chemical Engineering, an important property of a fiber is its water absorbency. A random sample of 20 pieces of cotton fiber was taken and the absorbency on each piece was measured. The following are the absorbency values: 18.71 21.41 20.72 21.81 19.29 22.43 20.17 23.71 19.44 20.50 18.92 20.33 23.00 22.85 19.25 21.77 22.11 19.77 18.04 21.12 (a) Calculate the sample mean and median for the above sample values. (b) Compute the 10% trimmed mean. (c) Do a dot plot of the absorbency data. (d) Using only the values of the mean, median, and trimmed mean, do you have evidence of outliers in the data?In a study conducted by the Department of Mechanical Engineering at Virginia Tech, the steel rods supplied by two different companies were compared. Ten sample springs were made out of the steel rods supplied by each company, and a measure of flexibility was recorded for each. The data are as follows: Company A: 9.3 8.8 6.8 8.7 8.5 6.7 8.0 6.5 9.2 7.0 Company B: 11.0 9.8 9.9 10.2 10.1 9.7 11.0 11.1 10.2 9.6 (a) Calculate the sample mean and median for the data for the two companies. (b) Plot the data for the two companies on the same line and give your impression regarding any apparent differences between the two companies. An overseas shipment of 5 foreign automobiles contains 2 that have slight paint blemishes. If an agency receives 3 of these automobiles at random, list the elements of the sample space S, using the letters Band / for blemished and nonblemished, respectively; then to each sample point assign a value x of the random variable X representing the number of automobiles with paint blemishes purchased by the agency.The following measurements were recorded for the drying time, in hours, of a certain brand of latex paint. 3.4 2.5 4.8 2.9 3.6 2.8 3.3 5.6 3.7 2.8 4.4 4.0 5.2 3.0 4.8 Assume that the measurements are a simple random sample. (a) What is the sample size for the above sample? (b) Calculate the sample mean for these data. (c) Calculate the sample median. (d) Plot the data by way of a dot plot. (e) Compute the 20% trimmed mean for the above data set. (f) Is the sample mean for these data more or less descriptive as a center of location than the trimmed mean?A pipeline engineer working in Kuwait for the oil giant BP wants to perform a present worth analysis on alternative pipeline routings-the first predominately by land and the second primarily undersea. The un- dersea route is more expensive initially due to extra corrosion protection and installation costs, but cheaper security and maintenance reduces annual costs. Per- form the analysis for the engineer at 15% per year.From a box containing 4 dimes and 2 nickels, 3 coins are selected at random without replacement. Find the probability distribution for the total 7 of the 3 coins. Express the probability distribution graphically as a probability histogram. Consider the birthdays of the students in a class of size r. Assume that the year consists of 365 days. (a) How many different ordered samples of birthdays are possible (r in sample) allowing repetitions (with replacement)? (b) The same as part (a), except requiring that all the students have different birthdays (without replacement)? (c) If we can assume that each ordered outcome in part (a) has the same probability, what is the probability that at least two students have the same birthday? (d) For what value of r is the probability in part (c) about equal to 1/2? Is this number surprisingly small? Hint: Use a calculator or computer to find r.Assume an engineering company borrows $100,000 at 10% per year compound interest and will pay the principal and all the interest after 3 years. Compute the annual interest and total amount due after 3 years. Graph the interest and total owed for each year, and compare with the previous example that involved simple interest.\f