solve the question
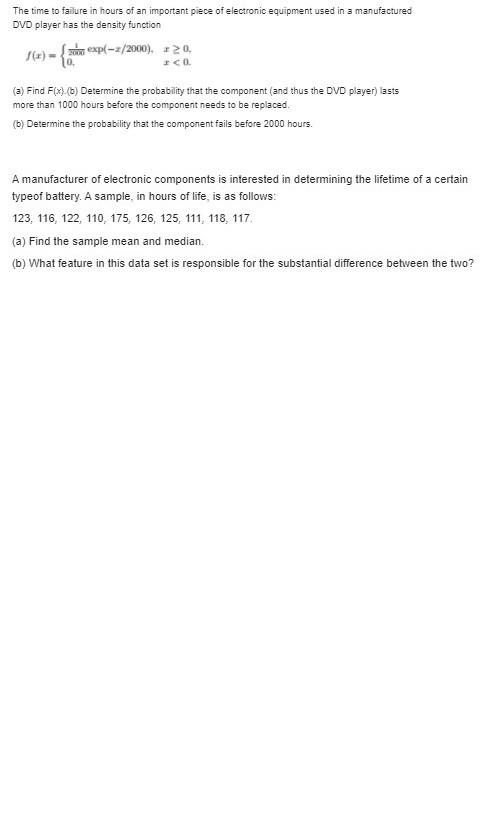
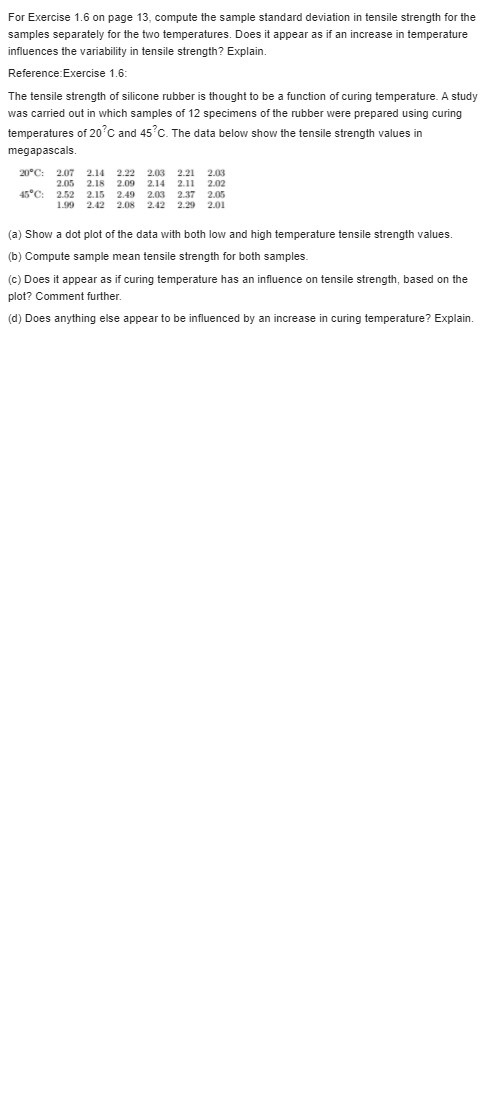
Consider the data in Exercise 1.5 on page 13. Compute the sample variance and the sample standard deviation for both control and treatment groups. Reference Exercise 1.5: Twenty adult males between the ages of 30 and 40 participated in a study to evaluate the effect of a specific health regimen involving diet and exercise on the blood cholesterol. Ten were randomly selected to be a control group, and ten others were assigned to take part in the regimen as the treatment group for a period of 6 months. The following data show the reduction in cholesterol experienced for the time period for the 20 subjects: Control group: 7 3 -4 14 2 522 -7 95 Treatment group: -6 5 9 4 4 12 37 5 3 3 (a) Do a dot plot of the data for both groups on the same graph. (b) Compute the mean, median, and 10% trimmed mean for both groups. (c) Explain why the difference in means suggests one conclusion about the effect of the regimen, while the difference in medians or trimmed means suggests a different conclusion.For the data of Exercise 1.4 on page 13, compute both the mean and the variance in "flexibility" for both company A and company B. Does there appear to be a difference in flexibility between company A and company B? Reference: Exercise 1.4: In a study conducted by the Department of Mechanical Engineering at Virginia Tech, the steel rods supplied by two different companies were compared. Ten sample springs were made out of the steel rods supplied by each company, and a measure of flexibility was recorded for each. The data are as follows: Company A: 9.3 8.8 6.8 8.7 8.5 6.7 8.0 6.5 9.27.0 Company B: 11.0 9.8 9.9 10.2 10.1 9.7 11.0 11.1 10.2 9.6 (a) Calculate the sample mean and median for the data for the two companies. (b) Plot the data for the two companies on the same line and give your impression regarding any apparent differences between the two companies.The time to failure in hours of an important piece of electronic equipment used in a manufactured DVD player has the density function /(z) = zin exp(-2/2000), 2 2 0. I CO. (3) Find F(x).(b) Determine the probability that the component (and thus the DVD player) lasts more than 1000 hours before the component needs to be replaced (b) Determine the probability that the component fails before 2000 hours. A manufacturer of electronic components is interested in determining the lifetime of a certain typeof battery. A sample, in hours of life, is as follows: 123, 116, 122, 110, 175, 126, 125, 111, 118, 117. (a) Find the sample mean and median. (b) What feature in this data set is responsible for the substantial difference between the two?\fA study of the effects of smoking on sleep patterns is conducted. The measure observed is the time, in minutes, that it takes to fall asleep. These data are obtained: Smokers: 69.3 56.0 22.1 47.6 53.2 48.1 52.7 34.4 60.2 43.8 23.2 13.8 Nonsmokers: 28.6 25.1 26.4 34.9 29.8 28.4 38.5 30.2 30.6 31.8 41.6 21.1 36.0 37.9 13.9 (a) Find the sample mean for each group. (b) Find the sample standard deviation for each group. (c) Make a dot plot of the data sets A and B on the same line. (d) Comment on what kind of impact smoking appears to have on the time required to fall asleepFor Exercise 1.6 on page 13, compute the sample standard deviation in tensile strength for the samples separately for the two temperatures. Does it appear as if an increase in temperature influences the variability in tensile strength? Explain. Reference: Exercise 1.6: The tensile strength of silicone rubber is thought to be a function of curing temperature. A study was carried out in which samples of 12 specimens of the rubber were prepared using curing temperatures of 20 C and 45 C. The data below show the tensile strength values in megapascals. 20 C: 2.07 2.14 2.22 2.03 2.21 2.03 2.05 2.18 2.09 2.14 2.11 2.02 45"C: 2.52 2.15 2.49 2.03 2.37 2.05 1.09 2.42 2.08 2.42 2.29 2.01 (a) Show a dot plot of the data with both low and high temperature tensile strength values. (b) Compute sample mean tensile strength for both samples. (c) Does it appear as if curing temperature has an influence on tensile strength, based on the plot? Comment further. (d) Does anything else appear to be influenced by an increase in curing temperature? Explain