solve the question
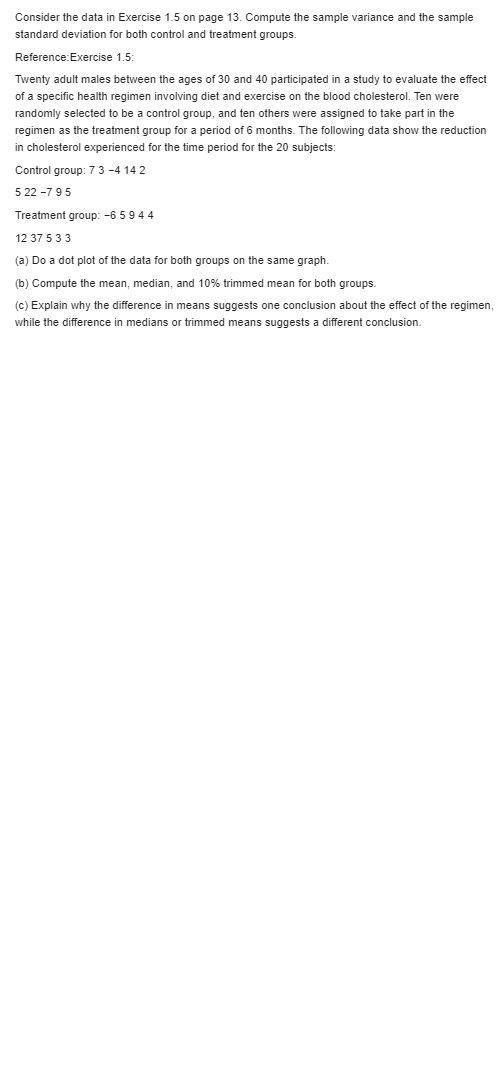
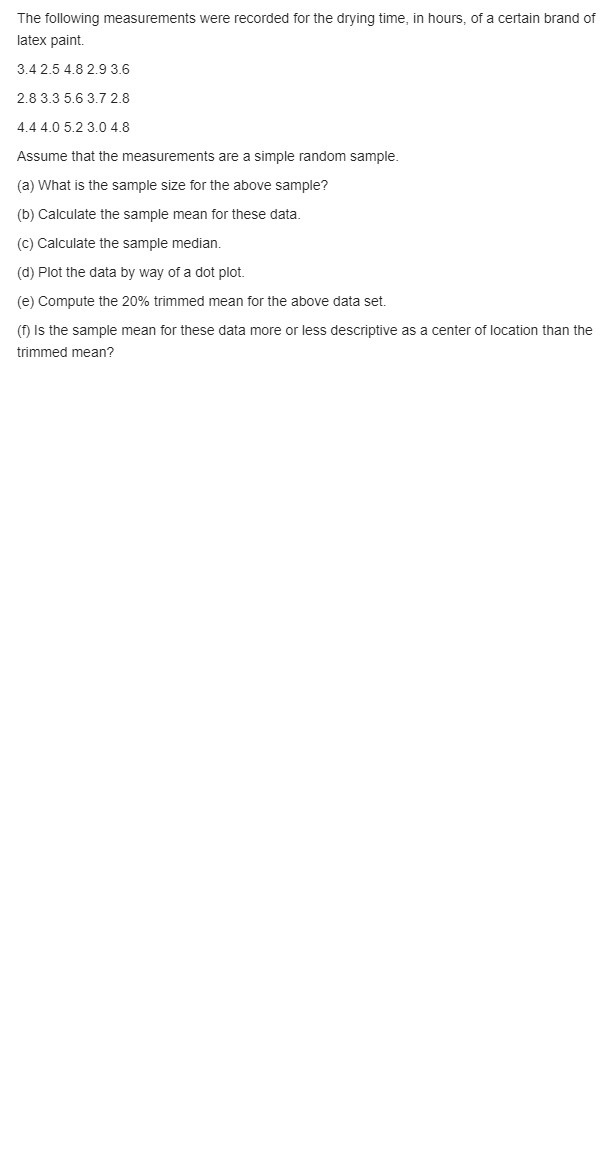
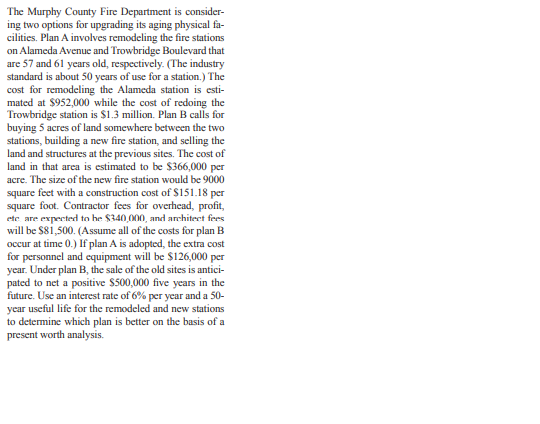
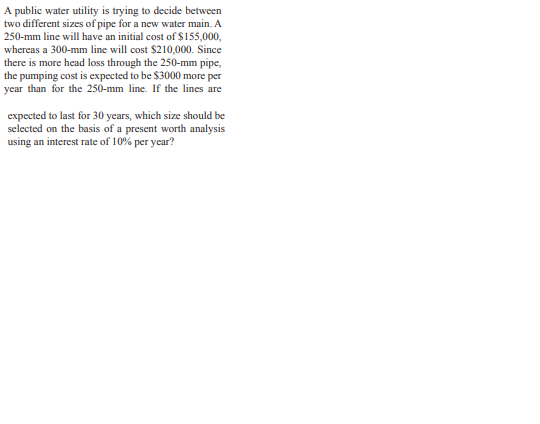
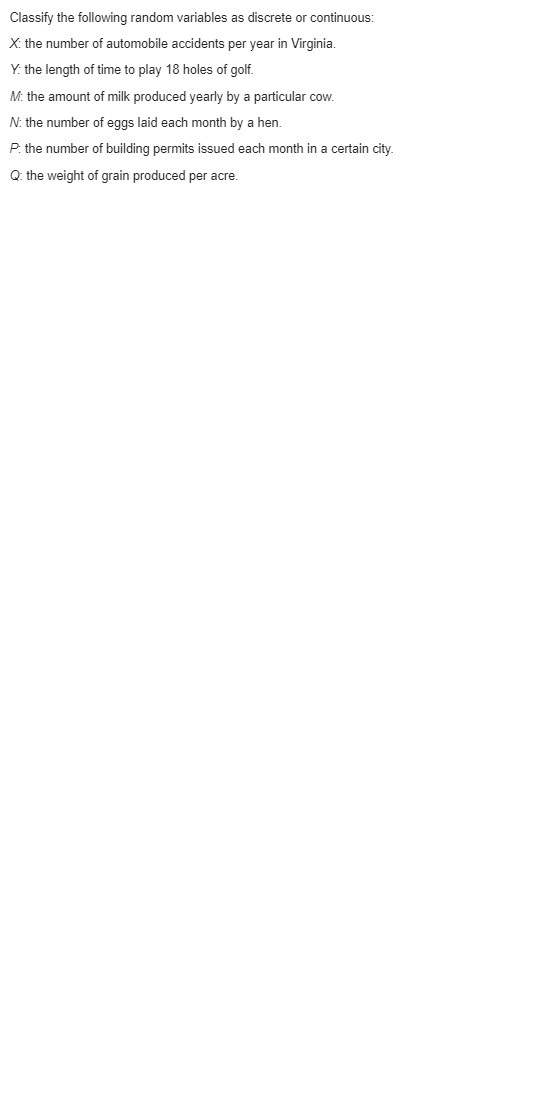
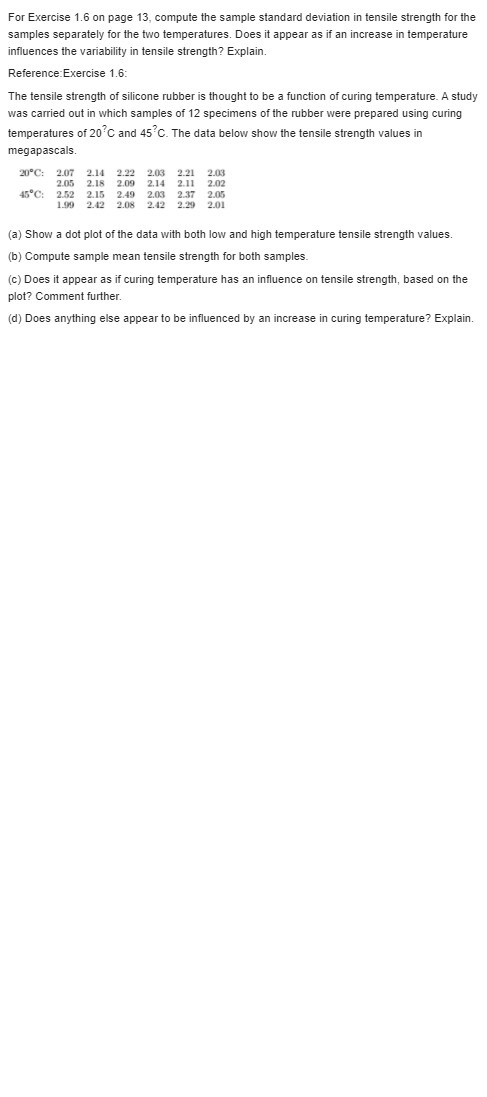
Consider the data in Exercise 1.5 on page 13. Compute the sample variance and the sample standard deviation for both control and treatment groups. Reference Exercise 1.5: Twenty adult males between the ages of 30 and 40 participated in a study to evaluate the effect of a specific health regimen involving diet and exercise on the blood cholesterol. Ten were randomly selected to be a control group, and ten others were assigned to take part in the regimen as the treatment group for a period of 6 months. The following data show the reduction in cholesterol experienced for the time period for the 20 subjects: Control group: 7 3 -4 14 2 522 -7 95 Treatment group: -6 5 9 4 4 12 37 5 3 3 (a) Do a dot plot of the data for both groups on the same graph. (b) Compute the mean, median, and 10% trimmed mean for both groups. (c) Explain why the difference in means suggests one conclusion about the effect of the regimen, while the difference in medians or trimmed means suggests a different conclusion.The following measurements were recorded for the drying time, in hours, of a certain brand of latex paint. 3.4 2.5 4.8 2.9 3.6 2.8 3.3 5.6 3.7 2.8 4.4 4.0 5.2 3.0 4.8 Assume that the measurements are a simple random sample. (a) What is the sample size for the above sample? (b) Calculate the sample mean for these data. (c) Calculate the sample median. (d) Plot the data by way of a dot plot. (e) Compute the 20% trimmed mean for the above data set. (f) Is the sample mean for these data more or less descriptive as a center of location than the trimmed mean?The Murphy County Fire Department is consider- ing two options for upgrading its aging physical fa- cilities. Plan A involves remodeling the fire stations on Alameda Avenue and Trowbridge Boulevard that are 57 and 61 years old, respectively. (The industry standard is about 50 years of use for a station.) The cost for remodeling the Alameda station is esti- mated at $952,000 while the cost of redoing the Trowbridge station is $1.3 million. Plan B calls for buying 5 acres of land somewhere between the two stations, building a new fire station, and selling the land and structures at the previous sites. The cost of land in that area is estimated to be $366,000 per acre. The size of the new fire station would be 9000 square feet with a construction cost of $151.18 per square foot. Contractor fees for overhead, profit, etc. are expected to be $140,000, and architect fees will be $81,500. (Assume all of the costs for plan B occur at time 0.) If plan A is adopted, the extra cost for personnel and equipment will be $126,000 per year. Under plan B, the sale of the old sites is antici- pated to net a positive $500,000 five years in the future. Use an interest rate of 6% per year and a 50- year useful life for the remodeled and new stations to determine which plan is better on the basis of a present worth analysis.A public water utility is trying to decide between two different sizes of pipe for a new water main. A 250-mm line will have an initial cost of $155,000, whereas a 300-mm line will cost $210,000. Since there is more head loss through the 250-mm pipe, the pumping cost is expected to be $3000 more per year than for the 250-mm line. If the lines are expected to last for 30 years, which size should be selected on the basis of a present worth analysis using an interest rate of 10% per year?Classify the following random variables as discrete or continuous: X: the number of automobile accidents per year in Virginia. Y: the length of time to play 18 holes of golf. M: the amount of milk produced yearly by a particular cow. N: the number of eggs laid each month by a hen. P. the number of building permits issued each month in a certain city. Q: the weight of grain produced per acre.\fFor Exercise 1.6 on page 13, compute the sample standard deviation in tensile strength for the samples separately for the two temperatures. Does it appear as if an increase in temperature influences the variability in tensile strength? Explain. Reference: Exercise 1.6: The tensile strength of silicone rubber is thought to be a function of curing temperature. A study was carried out in which samples of 12 specimens of the rubber were prepared using curing temperatures of 20 C and 45 C. The data below show the tensile strength values in megapascals. 20 C: 2.07 2.14 2.22 2.03 2.21 2.03 2.05 2.18 2.09 2.14 2.11 2.02 45"C: 2.52 2.15 2.49 2.03 2.37 2.05 1.09 2.42 2.08 2.42 2.29 2.01 (a) Show a dot plot of the data with both low and high temperature tensile strength values. (b) Compute sample mean tensile strength for both samples. (c) Does it appear as if curing temperature has an influence on tensile strength, based on the plot? Comment further. (d) Does anything else appear to be influenced by an increase in curing temperature? Explain
