solve the question
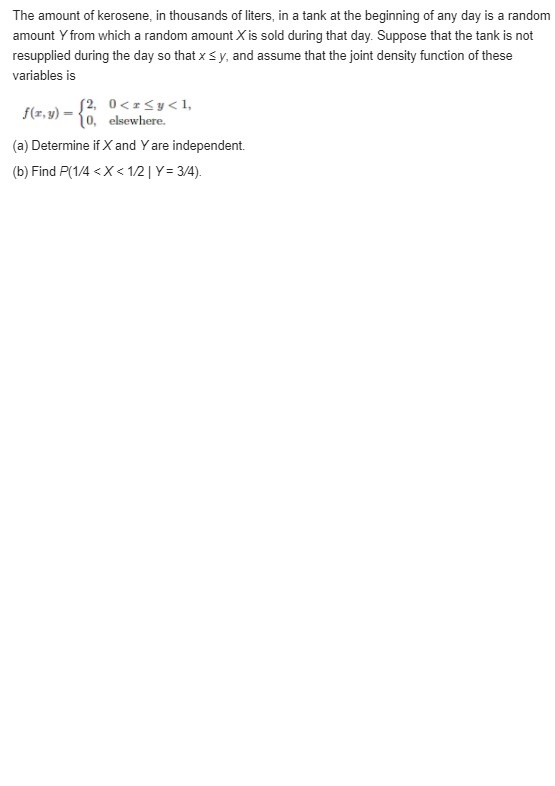
Exercise 1.3 on page 13 showed tensile strength data for two samples, one in which specimens were exposed to an aging process and one in which there was no aging of the specimens. (a) Calculate the sample variance as well as standard deviation in tensile strength for both samples. (b) Does there appear to be any evidence that aging affects the variability in tensile strength? (See also the plot for Exercise 1.3 on page 13.) Reference: Exercise 1.3: A certain polymer is used for evacuation systems for aircraft. It is important that the polymer be resistant to the aging process. Twenty specimens of the polymer were used in an experiment. Ten were assigned randomly to be exposed to an accelerated batch aging process that involved exposure to high temperatures for 10 days. Measurements of tensile strength of the specimens were made, and the following data were recorded on tensile strength in psi: No aging: 227 222 218 217 225 218 216 229 228 221 Aging: 219 214 215 211 209 218 203 204 201 205 (a) Do a dot plot of the data. (b) From your plot, does it appear as if the aging process has had an effect on the tensile strength of thispolymer? Explain. (c) Calculate the sample mean tensile strength of the two samples. (d) Calculate the median for both. Discuss the similarity or lack of similarity between the mean andmedian of each group.A certain polymer is used for evacuation systems for aircraft. It is important that the polymer be resistant to the aging process. Twenty specimens of the polymer were used in an experiment. Ten were assigned randomly to be exposed to an accelerated batch aging process that involved exposure to high temperatures for 10 days. Measurements of tensile strength of the specimens were made, and the following data were recorded on tensile strength in psi: No aging: 227 222 218 217 225 218 216 229 228 221 Aging: 219 214 215 211 209 218 203 204 201 205 (a) Do a dot plot of the data. (b) From your plot, does it appear as if the aging process has had an effect on the tensile strength of thispolymer? Explain. (c) Calculate the sample mean tensile strength of the two samples. (d) Calculate the median for both. Discuss the similarity or lack of similarity between the mean andmedian of each group.Three cards are drawn in succession from a deck without replacement. Find the probability distribution for the number of spades. Find a formula for the probability distribution of the random variable X representing the outcome when a single die is rolled once. Find the probability distribution of the random variable Win Exercise 3.3, assuming that the coin is biased so that a head is twice as likely to occur as a tail. Reference: Exercise 3.3: Let Wbe a random variable giving the number of heads minus the number of tails in three tosses of a coin. List the elements of the sample space S for the three tosses of the coin and to each sample point assign a value w of W.The amount of kerosene, in thousands of liters, in a tank at the beginning of any day is a random amount Y from which a random amount X is sold during that day. Suppose that the tank is not resupplied during the day so that x sy, and assume that the joint density function of these variables is 12, 0
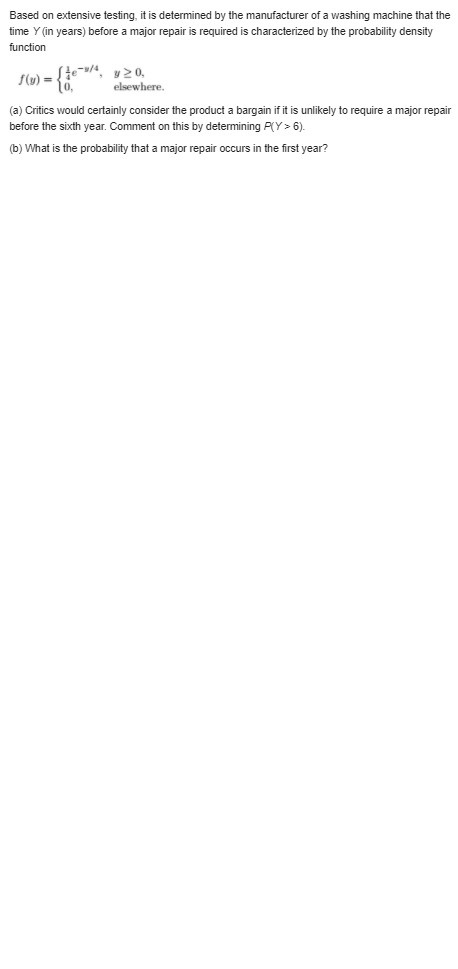
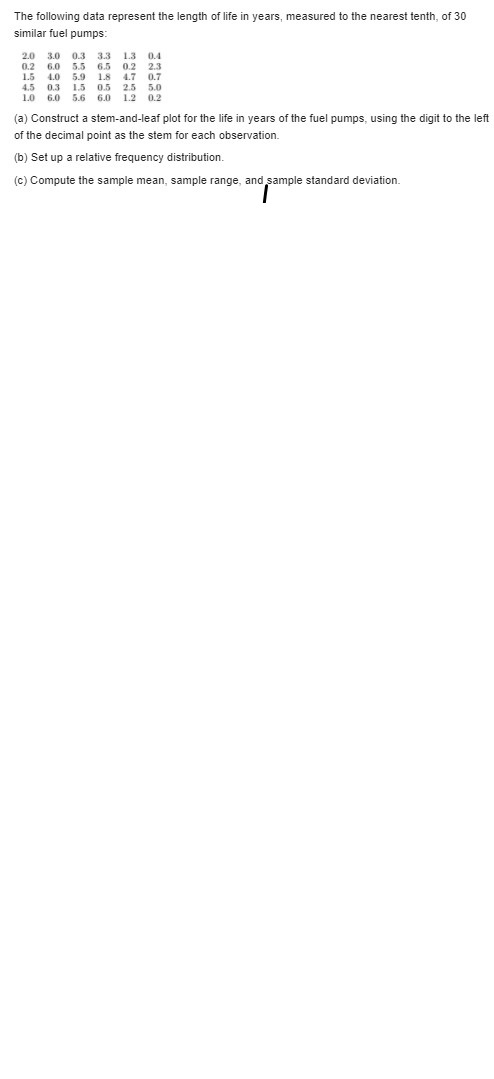
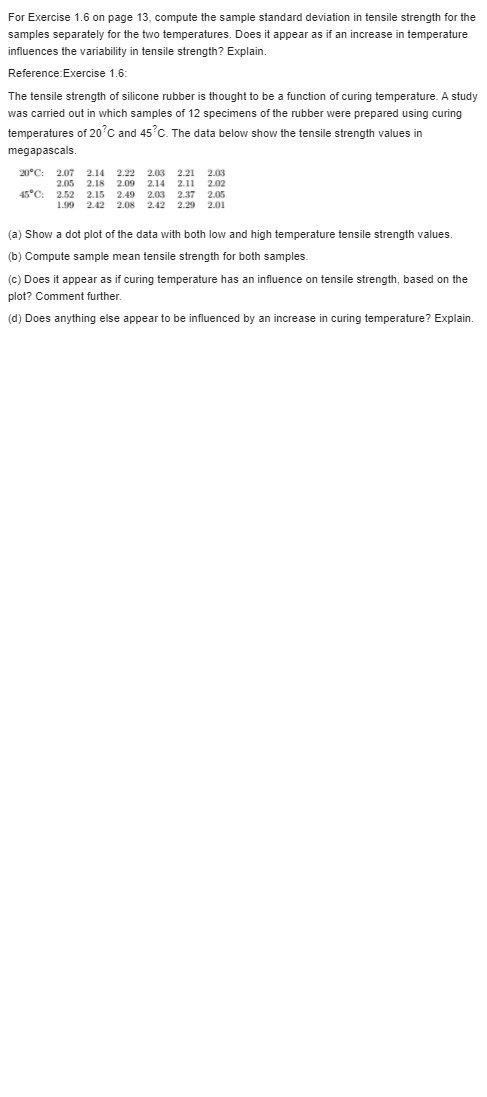
6). (b) What is the probability that a major repair occurs in the first year?The following data represent the length of life in years, measured to the nearest tenth, of 30 similar fuel pumps: 2.0 3.0 0.3 3.3 1.3 0.4 0.2 6.0 6.5 0.2 2.3 1.5 4.7 0.7 4.5 0,3 1.5 0.5 2.5 5.0 1.0 6.0 5.6 6.0 1.2 0.2 (a) Construct a stem-and-leaf plot for the life in years of the fuel pumps, using the digit to the left of the decimal point as the stem for each observation. (b) Set up a relative frequency distribution. (c) Compute the sample mean, sample range, and sample standard deviation.For Exercise 1.6 on page 13, compute the sample standard deviation in tensile strength for the samples separately for the two temperatures. Does it appear as if an increase in temperature influences the variability in tensile strength? Explain. Reference: Exercise 1.6: The tensile strength of silicone rubber is thought to be a function of curing temperature. A study was carried out in which samples of 12 specimens of the rubber were prepared using curing temperatures of 20 C and 45 C. The data below show the tensile strength values in megapascals. 20 C: 2.07 2.14 2.22 2.03 2.21 2.03 2.05 2.18 2.09 2.14 2.11 2.02 45"C: 2.52 2.15 2.49 2.03 2.37 2.05 1.09 2.42 2.08 2.42 2.29 2.01 (a) Show a dot plot of the data with both low and high temperature tensile strength values. (b) Compute sample mean tensile strength for both samples. (c) Does it appear as if curing temperature has an influence on tensile strength, based on the plot? Comment further. (d) Does anything else appear to be influenced by an increase in curing temperature? Explain