Solve the question
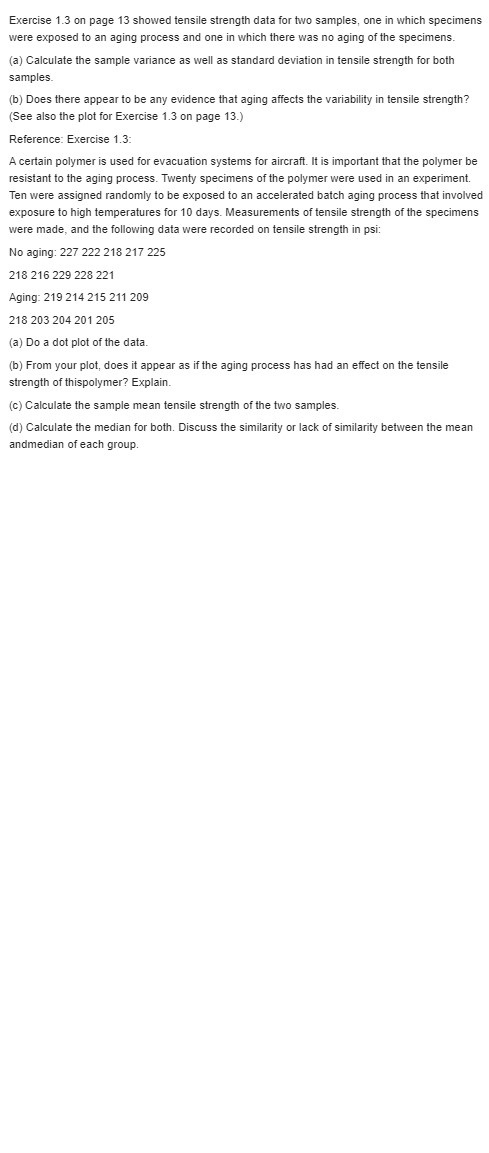
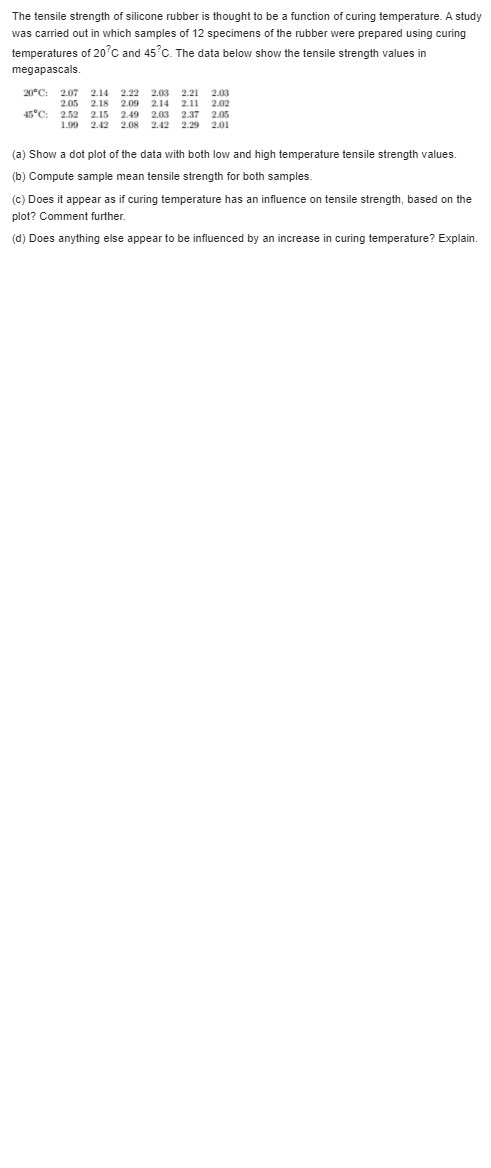
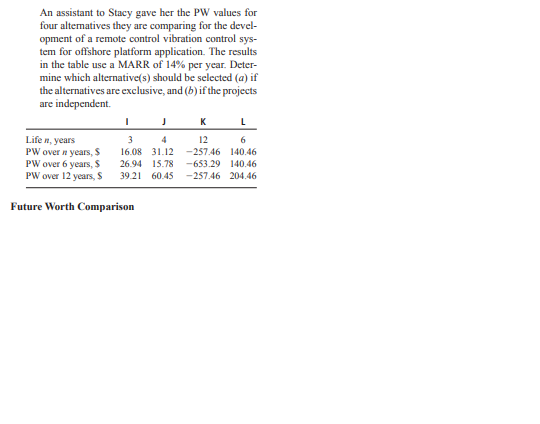
Exercise 1.3 on page 13 showed tensile strength data for two samples, one in which specimens were exposed to an aging process and one in which there was no aging of the specimens. (a) Calculate the sample variance as well as standard deviation in tensile strength for both samples. (b) Does there appear to be any evidence that aging affects the variability in tensile strength? (See also the plot for Exercise 1.3 on page 13.) Reference: Exercise 1.3: A certain polymer is used for evacuation systems for aircraft. It is important that the polymer be resistant to the aging process. Twenty specimens of the polymer were used in an experiment. Ten were assigned randomly to be exposed to an accelerated batch aging process that involved exposure to high temperatures for 10 days. Measurements of tensile strength of the specimens were made, and the following data were recorded on tensile strength in psi: No aging: 227 222 218 217 225 218 216 229 228 221 Aging: 219 214 215 211 209 218 203 204 201 205 (a) Do a dot plot of the data. (b) From your plot, does it appear as if the aging process has had an effect on the tensile strength of thispolymer? Explain. (c) Calculate the sample mean tensile strength of the two samples. (d) Calculate the median for both. Discuss the similarity or lack of similarity between the mean andmedian of each group.The tensile strength of silicone rubber is thought to be a function of curing temperature. A study was carried out in which samples of 12 specimens of the rubber were prepared using curing temperatures of 20 C and 45 C. The data below show the tensile strength values in megapascals. 20 C: 2.07 2.14 2.22 2.03 2.21 2.03 2.05 2.18 2.09 2.14 2.11 2.02 45"C: 2.52 2.15 2.49 2.03 2.37 2.05 1.99 2.42 2.08 2.42 2.29 2.01 (a) Show a dot plot of the data with both low and high temperature tensile strength values. (b) Compute sample mean tensile strength for both samples. (c) Does it appear as if curing temperature has an influence on tensile strength, based on the plot? Comment further. (d) Does anything else appear to be influenced by an increase in curing temperature? Explain.Anion, an environmental engineering consulting firm, is trying to be eco-friendly in acquiring an au- tomobile for general office use. It is considering a gasoline-electric hybrid and a gasoline-free all- electric hatchback. The hybrid under consideration is GM's Volt, which will cost $35,000 and have a range of 40 miles on the electric battery and several hundred more miles when the gasoline engine kicks in. Nissan's Leaf, on the other hand, is a pure electric that will have a range of only 100 miles, after which its lithium-ion battery will have to be recharged. The Leaf's relatively limited range cre- ates a psychological effect known as range anxiety. This fact alone has caused the company to lean to- ward purchasing the Volt, which is assumed to have a salvage value of $15,000 in 5 years. The Leaf could be leased for $349 per month (end-of-month payments) for 5 years after an initial $1500 down payment for "account activation." If the consulting company plans to ignore the range anxiety effect in making its decision, which automobile is the better option on the basis of a present worth analysis at an interest rate of 0.75% per month? Assume the oper- ating cost will be the same for both vehicles.An assistant to Stacy gave her the PW values for four alternatives they are comparing for the devel- opment of a remote control vibration control sys- tem for offshore platform application. The results in the table use a MARR of 14% per year. Deter- mine which alternative(s) should be selected (a) if the alternatives are exclusive, and (b) if the projects are independent. K Life n, years 3 12 6 PW over a years, $ 16/08 31.12 -257.46 140.46 PW over 6 years, $ 26.94 15.78 -653.29 140.46 PW over 12 years, $ 39.21 60.45 -257.46 204.46 Future Worth Comparison\f