

Question: solve the question For the data of Exercise 1.4 on page 13, compute both the mean and the variance in flexibility for both company A
solve the question

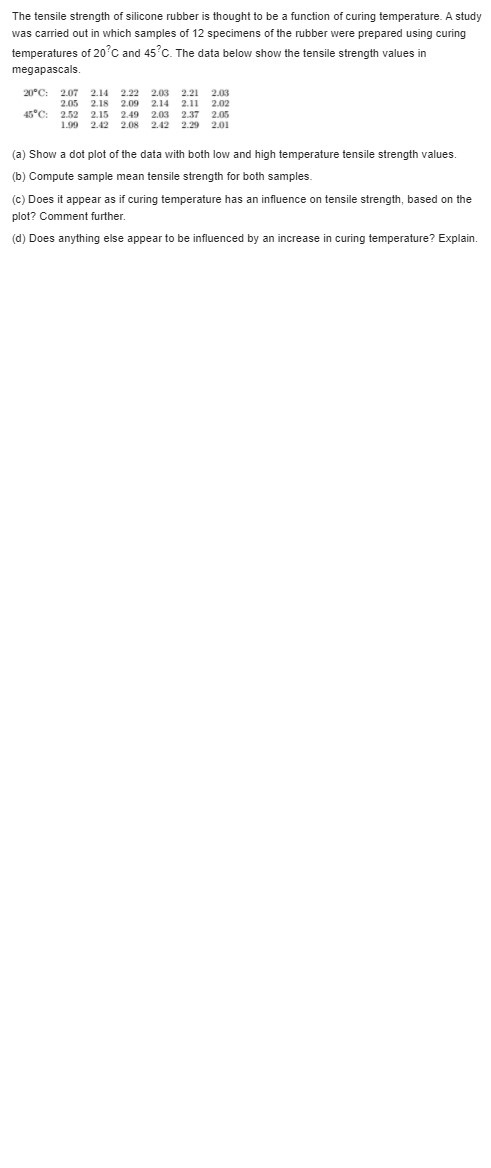
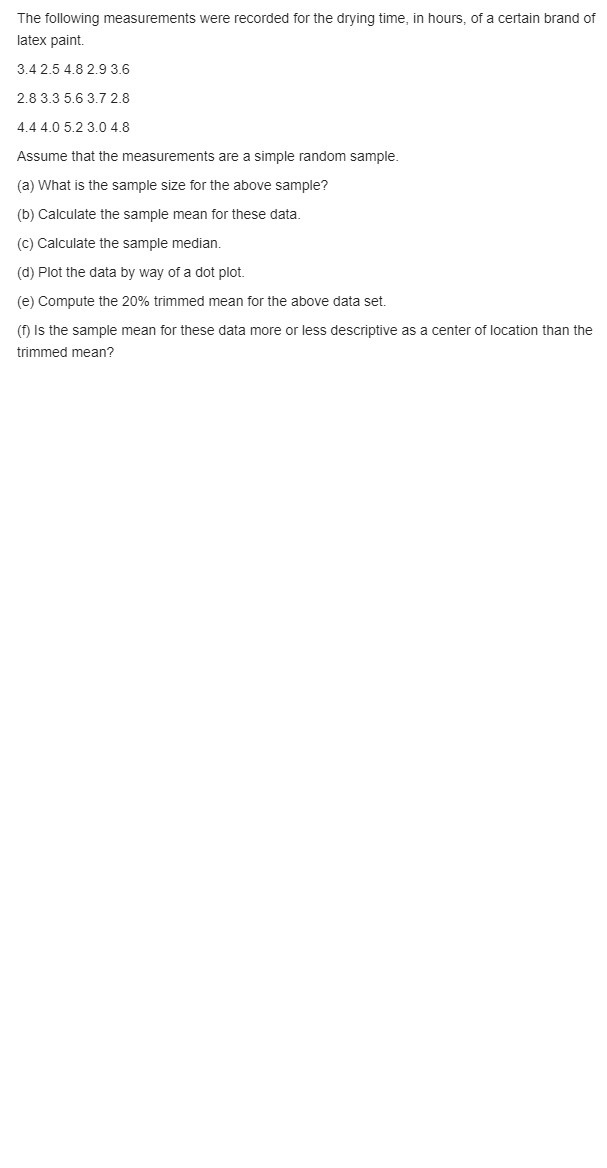
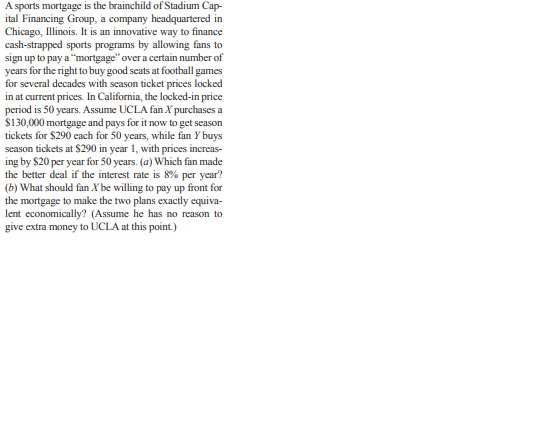
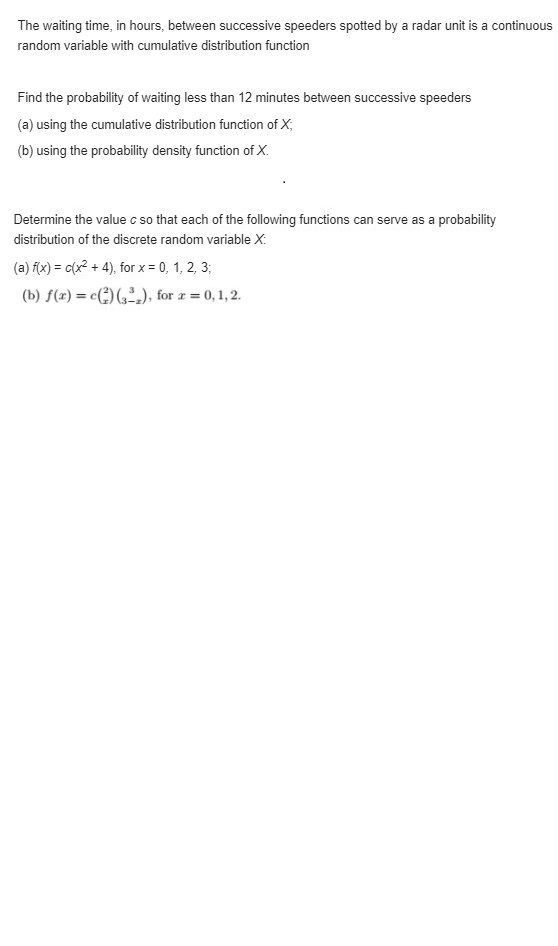
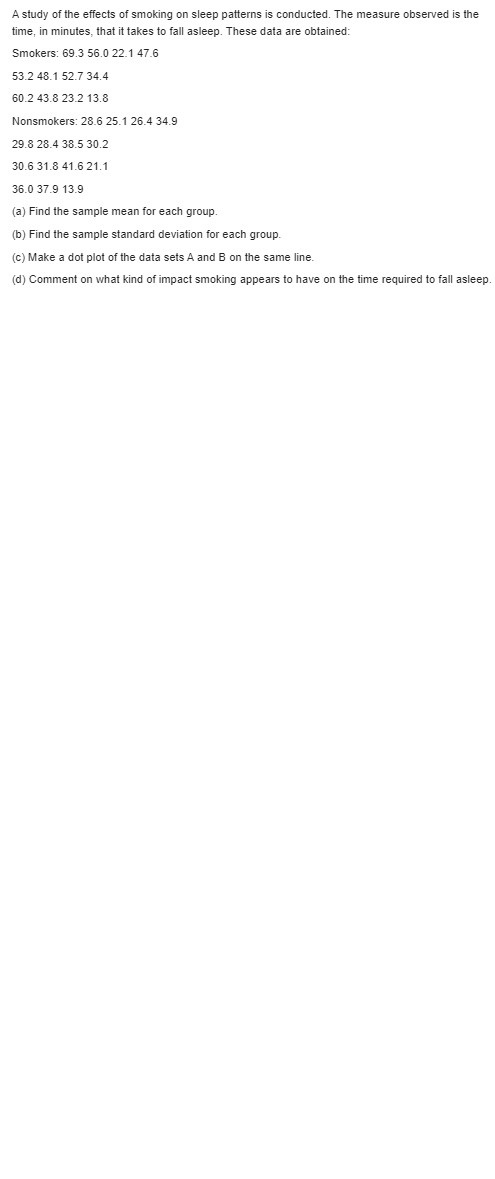
For the data of Exercise 1.4 on page 13, compute both the mean and the variance in "flexibility" for both company A and company B. Does there appear to be a difference in flexibility between company A and company B? Reference: Exercise 1.4: In a study conducted by the Department of Mechanical Engineering at Virginia Tech, the steel rods supplied by two different companies were compared. Ten sample springs were made out of the steel rods supplied by each company, and a measure of flexibility was recorded for each. The data are as follows: Company A: 9.3 8.8 6.8 8.7 8.5 6.7 8.0 6.5 9.27.0 Company B: 11.0 9.8 9.9 10.2 10.1 9.7 11.0 11.1 10.2 9.6 (a) Calculate the sample mean and median for the data for the two companies. (b) Plot the data for the two companies on the same line and give your impression regarding any apparent differences between the two companies.The tensile strength of silicone rubber is thought to be a function of curing temperature. A study was carried out in which samples of 12 specimens of the rubber were prepared using curing temperatures of 20 C and 45 C. The data below show the tensile strength values in megapascals. 20 C: 2.07 2.14 2.22 2.03 2.21 2.03 2.05 2.18 2.09 2.14 2.11 2.02 45"C: 2.52 2.15 2.49 2.03 2.37 2.05 1.99 2.42 2.08 2.42 2.29 2.01 (a) Show a dot plot of the data with both low and high temperature tensile strength values. (b) Compute sample mean tensile strength for both samples. (c) Does it appear as if curing temperature has an influence on tensile strength, based on the plot? Comment further. (d) Does anything else appear to be influenced by an increase in curing temperature? Explain.The following measurements were recorded for the drying time, in hours, of a certain brand of latex paint. 3.4 2.5 4.8 2.9 3.6 2.8 3.3 5.6 3.7 2.8 4.4 4.0 5.2 3.0 4.8 Assume that the measurements are a simple random sample. (a) What is the sample size for the above sample? (b) Calculate the sample mean for these data. (c) Calculate the sample median. (d) Plot the data by way of a dot plot. (e) Compute the 20% trimmed mean for the above data set. (f) Is the sample mean for these data more or less descriptive as a center of location than the trimmed mean?A sports mortgage is the brainchild of Stadium Cap- ital Financing Group, a company headquartered in Chicago, Illinois. It is an innovative way to finance cash-strapped sports programs by allowing fans to sign up to pay a "mortgage" over a certain number of years for the right to buy good seats at football games for several decades with season ticket prices locked in at current prices. In California, the locked-in price period is 50 years. Assume UCLA fan X' purchases a $130,000 mortgage and pays for it now to get season tickets for $290 each for 50 years, while fan Y' buys season tickets at $290 in year 1, with prices increase ing by $20 per year for 50 years. (a) Which fan made the better deal if the interest rate is 8% per year? (b) What should fan X be willing to pay up front for the mortgage to make the two plans exactly equiva- lent economically? (Assume he has no reason to give extra money to UCLA at this point.)The waiting time, in hours, between successive speeders spotted by a radar unit is a continuous random variable with cumulative distribution function Find the probability of waiting less than 12 minutes between successive speeders (a) using the cumulative distribution function of X; (b) using the probability density function of X. Determine the value c so that each of the following functions can serve as a probability distribution of the discrete random variable X: (a) f(x) = c(x2 + 4), for x = 0, 1, 2, 3; (b) f(x) = c() (->), for x = 0, 1, 2.A study of the effects of smoking on sleep patterns is conducted. The measure observed is the time, in minutes, that it takes to fall asleep. These data are obtained: Smokers: 69.3 56.0 22.1 47.6 53.2 48.1 52.7 34.4 60.2 43.8 23.2 13.8 Nonsmokers: 28.6 25.1 26.4 34.9 29.8 28.4 38.5 30.2 30.6 31.8 41.6 21.1 36.0 37.9 13.9 (a) Find the sample mean for each group. (b) Find the sample standard deviation for each group. (c) Make a dot plot of the data sets A and B on the same line. (d) Comment on what kind of impact smoking appears to have on the time required to fall asleep
Step by Step Solution
There are 3 Steps involved in it

Get step-by-step solutions from verified subject matter experts