solve the question
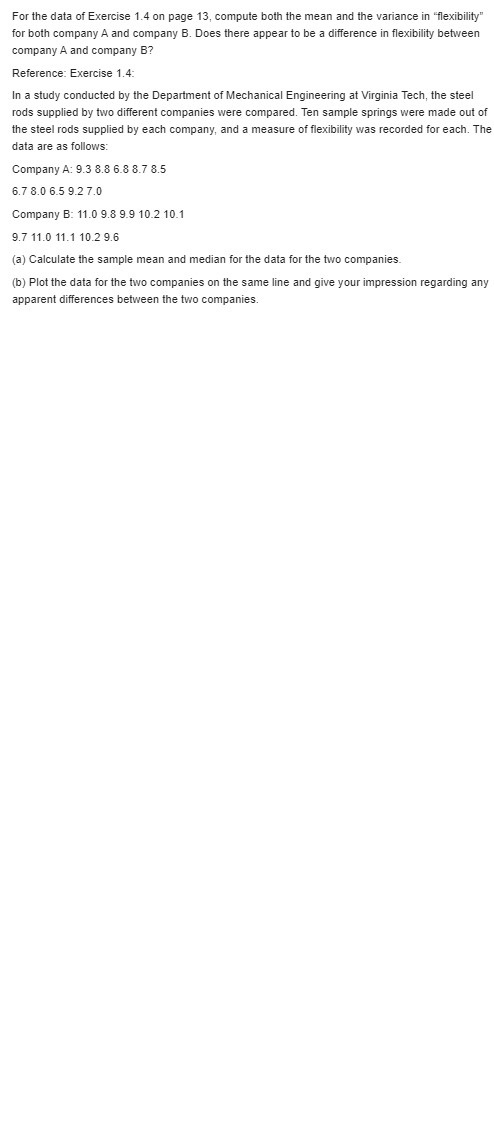
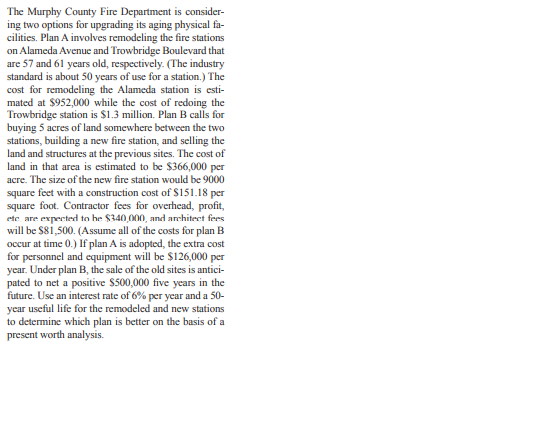
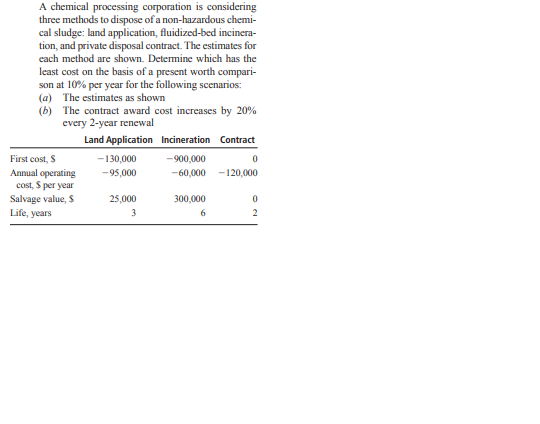
For the data of Exercise 1.4 on page 13, compute both the mean and the variance in "flexibility" for both company A and company B. Does there appear to be a difference in flexibility between company A and company B? Reference: Exercise 1.4: In a study conducted by the Department of Mechanical Engineering at Virginia Tech, the steel rods supplied by two different companies were compared. Ten sample springs were made out of the steel rods supplied by each company, and a measure of flexibility was recorded for each. The data are as follows: Company A: 9.3 8.8 6.8 8.7 8.5 6.7 8.0 6.5 9.27.0 Company B: 11.0 9.8 9.9 10.2 10.1 9.7 11.0 11.1 10.2 9.6 (a) Calculate the sample mean and median for the data for the two companies. (b) Plot the data for the two companies on the same line and give your impression regarding any apparent differences between the two companies.Compute the sample variance and standard deviation for the water absorbency data of Exercise 1.2 on page 13. Reference: Exercise 1.2 According to the journal Chemical Engineering, an important property of a fiber is its water absorbency. A random sample of 20 pieces of cotton fiber was taken and the absorbency on each piece was measured. The following are the absorbency values: 18.71 21.41 20.72 21.81 19.29 22.43 20.17 23.71 19.44 20.50 18.92 20.33 23.00 22.85 19.25 21.77 22.11 19.77 18.04 21.12 (a) Calculate the sample mean and median for the above sample values. (b) Compute the 10% trimmed mean. (c) Do a dot plot of the absorbency data. (d) Using only the values of the mean, median, and trimmed mean, do you have evidence of outliers in the data?In a study conducted by the Department of Mechanical Engineering at Virginia Tech, the steel rods supplied by two different companies were compared. Ten sample springs were made out of the steel rods supplied by each company, and a measure of flexibility was recorded for each. The data are as follows: Company A: 9.3 8.8 6.8 8.7 8.5 6.7 8.0 6.5 9.2 7.0 Company B: 11.0 9.8 9.9 10.2 10.1 9.7 11.0 11.1 10.2 9.6 (a) Calculate the sample mean and median for the data for the two companies. (b) Plot the data for the two companies on the same line and give your impression regarding any apparent differences between the two companies. An overseas shipment of 5 foreign automobiles contains 2 that have slight paint blemishes. If an agency receives 3 of these automobiles at random, list the elements of the sample space S, using the letters Band / for blemished and nonblemished, respectively; then to each sample point assign a value x of the random variable X representing the number of automobiles with paint blemishes purchased by the agency.The Murphy County Fire Department is consider- ing two options for upgrading its aging physical fa- cilities. Plan A involves remodeling the fire stations on Alameda Avenue and Trowbridge Boulevard that are 57 and 61 years old, respectively. (The industry standard is about 50 years of use for a station.) The cost for remodeling the Alameda station is esti- mated at $952,000 while the cost of redoing the Trowbridge station is $1.3 million. Plan B calls for buying 5 acres of land somewhere between the two stations, building a new fire station, and selling the land and structures at the previous sites. The cost of land in that area is estimated to be $366,000 per acre. The size of the new fire station would be 9000 square feet with a construction cost of $151.18 per square foot. Contractor fees for overhead, profit, etc. are expected to be $140,000, and architect fees will be $81,500. (Assume all of the costs for plan B occur at time 0.) If plan A is adopted, the extra cost for personnel and equipment will be $126,000 per year. Under plan B, the sale of the old sites is antici- pated to net a positive $500,000 five years in the future. Use an interest rate of 6% per year and a 50- year useful life for the remodeled and new stations to determine which plan is better on the basis of a present worth analysis.A pipeline engineer working in Kuwait for the oil giant BP wants to perform a present worth analysis on alternative pipeline routings-the first predominately by land and the second primarily undersea. The un- dersea route is more expensive initially due to extra corrosion protection and installation costs, but cheaper security and maintenance reduces annual costs. Per- form the analysis for the engineer at 15% per year.A chemical processing corporation is considering three methods to dispose of a non-hazardous chemi- cal sludge: land application, fluidized-bed incinera tion, and private disposal contract. The estimates for each method are shown. Determine which has the least cost on the basis of a present worth compari- son at 10% per year for the following scenarios: (a) The estimates as shown (b) The contract award cost increases by 20% every 2-year renewal Land Application Incinerator Contract First cost, $ -130,000 -900,000 Annual operating -95,000 -60,000 -120,000 cost, $ per year Salvage value, $ 25,000 300,000 Life, years 3An assistant to Stacy gave her the PW values for four alternatives they are comparing for the devel- opment of a remote control vibration control sys- tem for offshore platform application. The results in the table use a MARR of 14% per year. Deter- mine which alternative(s) should be selected (a) if the alternatives are exclusive, and (b) if the projects are independent. K Life n, years 3 12 6 PW over a years, $ 16/08 31.12 -257.46 140.46 PW over 6 years, $ 26.94 15.78 -653.29 140.46 PW over 12 years, $ 39.21 60.45 -257.46 204.46 Future Worth ComparisonThe following scores represent the final examination grades for an elementary statistics course: 60 32 57 74 70 54 64 89 76 48 67 17 69 74 80 85 (a) Construct a stem-and-leaf plot for the examination grades in which the stems are 1, 2, 3, 9 (b) Construct a relative frequency histogram, draw an estimate of the graph of the distribution, and discuss the skewness of the distribution. (c) Compute the sample mean, sample median, and sample standard deviation