

Answered step by step
Verified Expert Solution
Question
1 Approved Answer
SOLVE THIS IN MATLAB!!!! Consider the following simplified scenario of the Covid - 1 9 pandemic. We divide the entire population into three classes: Susceptible
SOLVE THIS IN MATLAB!!!!
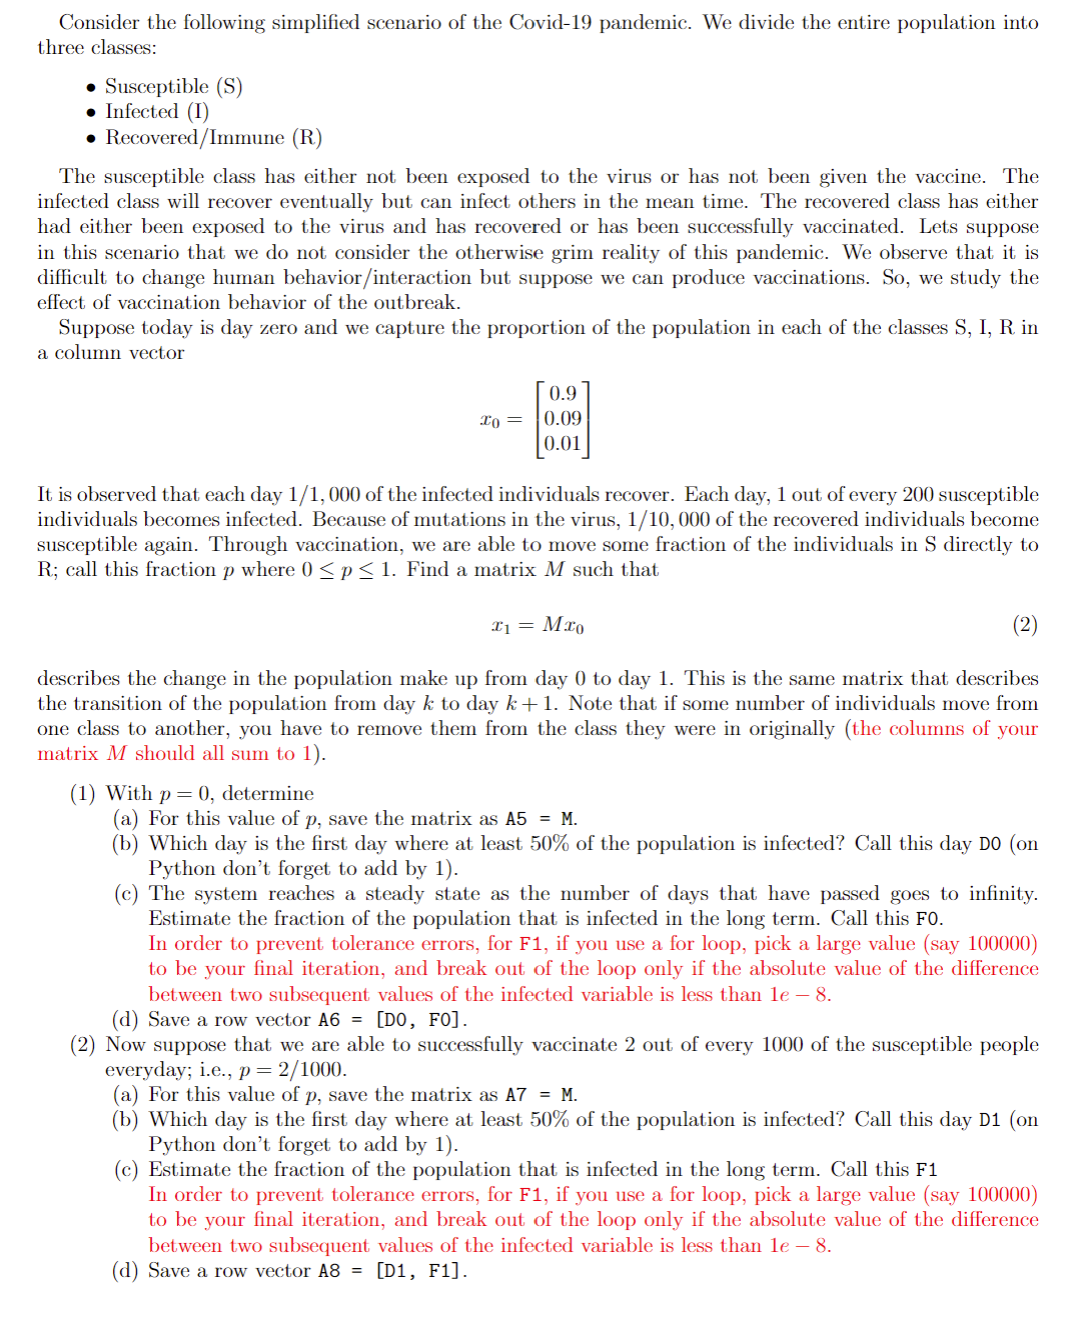
Consider the following simplified scenario of the Covid pandemic. We divide the entire population into
three classes:
Susceptible S
Infected I
RecoveredImmune R
The susceptible class has either not been exposed to the virus or has not been given the vaccine. The
infected class will recover eventually but can infect others in the mean time. The recovered class has either
had either been exposed to the virus and has recovered or has been successfully vaccinated. Lets suppose
in this scenario that we do not consider the otherwise grim reality of this pandemic. We observe that it is
difficult to change human behaviorinteraction but suppose we can produce vaccinations. So we study the
effect of vaccination behavior of the outbreak.
Suppose today is day zero and we capture the proportion of the population in each of the classes I, in
a column vector
It is observed that each day of the infected individuals recover. Each day, out of every susceptible
individuals becomes infected. Because of mutations in the virus, of the recovered individuals become
susceptible again. Through vaccination, we are able to move some fraction of the individuals in directly to
; call this fraction where Find a matrix such that
describes the change in the population make up from day to day This is the same matrix that describes
the transition of the population from day to day Note that if some number of individuals move from
one class to another, you have to remove them from the class they were in originally the columns of your
matrixM should all sum to
THIS IS MY CURRENT CODE ONLY A IS CORRECT
Given parameters
recoveryrate ;
infectionrate ;
reinfectionrate ;
Scenario : p
p ;
Transition matrix
M
infectionrate, reinfectionrate p;
infectionrate, recoveryrate, ;
recoveryrate, reinfectionrate p
;
Save the matrix as A
A M;
Initialize the state vector
x; ; ;
Simulation for steady state
for day :
x M x;
if day
D day;
F x; Fraction of population infected
elseif absx Fe
break;
end
end
FmaxminF;
Save the row vector AD F
AD F;
Scenario : p
p;
Update the transition matrix
M
infectionrate p reinfectionrate p;
infectionrate, recoveryrate, ;
p recoveryrate, reinfectionrate p
;
Save the matrix as A
A M;
Initialize the state vector
x; ; ;
Simulation for steady state
for day :
x M x;
if day
D day;
F x; Fraction of population infected
elseif absx Fe
break;
end
end
Save the row vector AD F
AD F;
Step by Step Solution
There are 3 Steps involved in it
Step: 1

Get Instant Access to Expert-Tailored Solutions
See step-by-step solutions with expert insights and AI powered tools for academic success
Step: 2

Step: 3
Ace Your Homework with AI
Get the answers you need in no time with our AI-driven, step-by-step assistance
Get Started
Structured Search For Big Data From Keywords To Key-objects
Authors: Mikhail Gilula
1st Edition
012804652X, 9780128046524