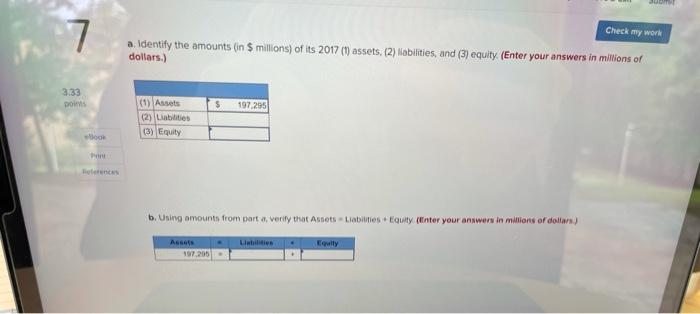
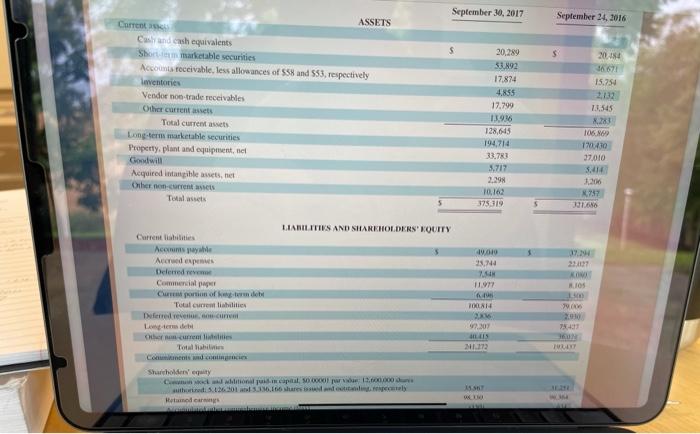
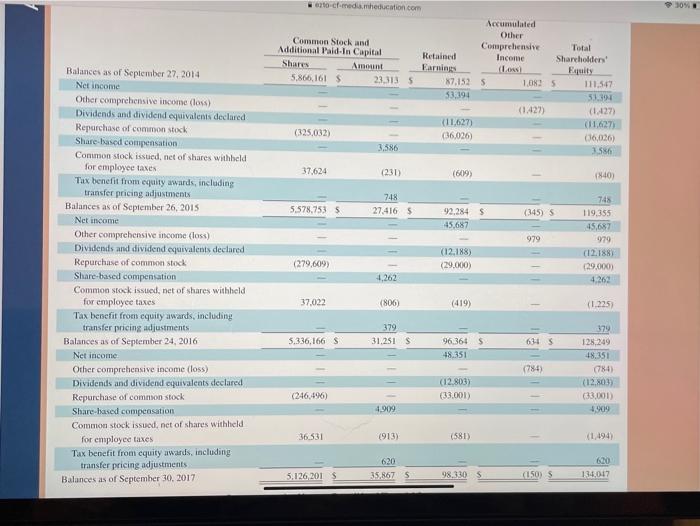
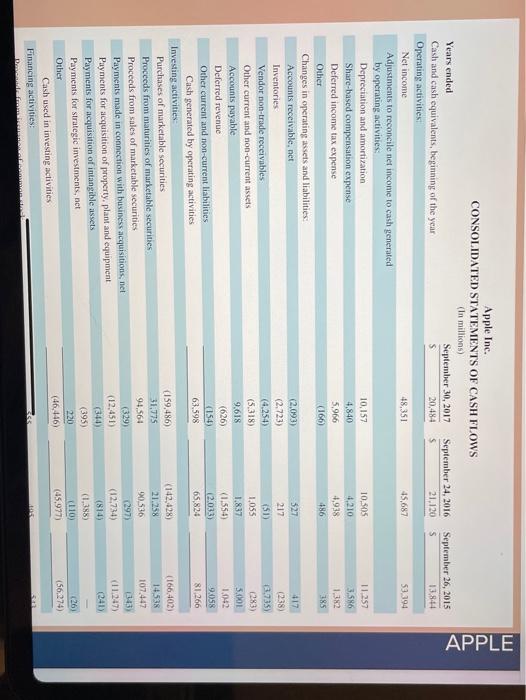
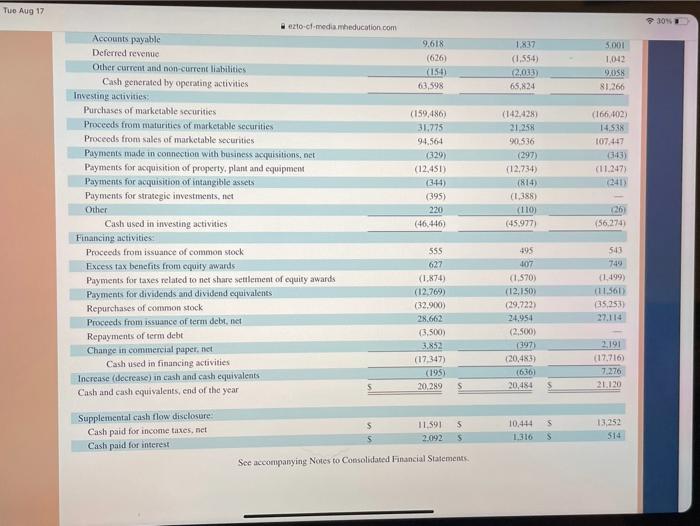
SOM Check my work 7 a. Identify the amounts (in $ millions) of its 2017 (1) assets. (2) liabilities, and (3) equity. (Enter your answers in millions of dollars.) 3.33 DOWY $ 197.295 (1) Assets (2) Liablities (3) Equity b. Using omounts from porta, verity that Annets Les Equity (Enter your answers in millions of dollars) Liabile - Asset 197.200 September 30, 2017 September 24, 2016 S ASSETS Care Cash and cash equivalents Shortmarketable securities Accounts receivable less allowances of $58 and 553, respectively mentories Vendor non-trade receivables Other current Total current assets Long-term marketable securities Property, plant and equipment, net Goodwill Acquired intangible assets, net Other non-current Total 20.289 33.892 17.874 4.855 17.799 13.9365 128,615 194,714 33.783 3.717 2.29 10.16 375319 20.154 18671 15.754 2,132 13.545 X.283 106.80p 17040 27.010 3.414 1.200 757 31.686 LIABILITIES AND SHAREHOLDERS' EQUITY 49.019 25.14 . 11.977 07.19 22,07 KON 105 Acne Accred expenses Deferred mene Commercial paper Creation of wordt "Totul curentiilities Terren Le debe hurrenties Totabilis TV TOXIC X 2.203 IS 1.172 Shurholders' equity Celoni cap al sol. Humode September 26, 2015 S 233,715 140,089 93,626 CONSOLIDATED STATEMENTS OF OPERATIONS (In millions, except number of shares which are reflected in thousands and per share amounts) Years ended September 30, 2017 September 24, 2016 Net sales S 229.234 S 215.639 Cost of sales 141.048 131.376 Gross margin 88,186 84.263 Operating expenses Research and development 11.581 10,045 Selling, general and administrative 15.261 14.194 Total operating expenses 26,842 24.239 Operating income 61.344 60,024 Other income (expense), net 2,745 1,348 Income before provision for income taxes 64.089 61,372 Provision for income taxes 15.738 15,685 Net income 48,351 45,687 8.067 14329 22.396 71.230 1.285 72,515 19.121 53.394 8.35 s S 9.28 9.22 Earnings per share Basic 9.27 Diluted 9.21 $ 8.31 Shares used in computing earnings per share: Basic 5.217.242 5,470,820 Diluted 5.251,692 5,500,281 Cash dividends declared per share 2.40 2.18 See accompanying Notes to Consolidated Financial Statements. 5.753.421 5.793.069 1.98 S Apple Inc. CONSOLIDATED STATEMENTS OF COMPREHENSIVE INCOME (In millions) September 30, 2017 September 24, 2016 Years ended September 26, 2015 53394 55697 September 26, 2015 S 53.394 S (411) 7 2,905 (3.497) Apple Inc. CONSOLIDATED STATEMENTS OF COMPREHENSIVE INCOME (In millions Years ended September 30, 2017 September 24, 2016 Net income 48.351 S 45,687 Other comprehensive income (loss) Change in foreign currency translation, net of tax effects of S(77), 58 and $201. respectively 224 75 Change in unrealized gains/losses on derivative instruments Change in fair value of derivatives, net of tax benefit (expense) of $(478), S(7) and $(441), respectively 1,315 Adjustment for net (gains) losses realized and included in net income, net of tax expense (benefit of $475.5131 and 5630, respectively (1.477) (741) Total change in unrealized gains/losses on derivative instruments, net of tax (162) (734) Change in unrealized gains/losses on marketable securities: Change in fair value of marketable securities, net of tax benefit (expense) of $425, 8(863) and $264, respectively (782) 1.582 Adjustment for net (gains) losses realized and included in net incomie, net of tax expense (benefit) of S35, 5(31), and S(32), respectively (64) 56 Total change in unrealized gains/losses on marketable securities, net of tax (846) 1.638 (784) Total other comprehensive income (loss) 47,567 46,666 Total comprehensive income See accompanying Notes to Consolidated Financial Statements, X592) (483 59 979 (424) (1.427) 51.967 to-cf-media.meducation.com 30% Total Common Stock and Additional Paid-In Capital Retained Shares Amount Earnings 5.866,161 $ 23.313 5 87.152 51194 Accumulated Other Comprehensive Income Shareholders Equity 1.0825 111.547 51.304 (1427) (1427) (11.627) (36,026) 1586 (325,032) (11.627) 36,026) 3.586 37,624 (231) (609) 1840) 748 27.416 5 5.578,7535 748 119.355 (345) 92.284 45,687 45.687 979 (279,609) (12.188) (29.000) Balances as of September 27, 2014 Net income Other comprehensive income (los) Dividends and dividend equivalents declared Repurchase of common stock Share-based compensation Common stock issued, net of shares withheld for employee taxes Tax benefit from equity awards, including transfer pricing adjustments Balances as of September 26, 2015 Net income Other comprehensive income (los) Dividends and dividend equivalents declared Repurchase of common stock Share-based compensation Common stock issued, net of shares withheld for employee taxes Tax benefit from equity awards, including transfer pricing adjustments Balances as of September 24, 2016 Net income Other comprehensive income (loss) Dividends and dividend equivalents declared Repurchase of common stock Share-based compensation Common stock issued, net of shares withheld for employee taxes Tax benefit from equity awards, including transfer pricing adjustments Balances as of September 30, 2017 979 (12.1887 (29.000 4.263 4,262 37.022 (806) (419) (1.225 379 5.336,166 S 31.251s $ 6315 96.36 48.351 (784) 379 128.249 48.351 (784) (12.8033 (33,001) 4,909 (12.803) (33.001) (246,496) 4.909 36.531 (913) (581) (1.494) 620 35,867 S 620 134,017 5,126, 201 98.330S (150) APPLE September 26, 2015 S 13844 53 394 11.257 3.586 1.382 385 Apple Inc. CONSOLIDATED STATEMENTS OF CASH FLOWS (In millions) Years ended September 30, 2017 Cash and cash equivalents, beginning of the year September 24, 2016 20,484 21.120 Operating activities Net income 48,351 45,687 Adjustments to reconcile net income to cash generated by operating activities Depreciation and amortization 10,157 10.505 Share-based compensation expense 4.840 4,210 Deferred income tax expense 5.966 4,938 Other (166) 486 Changes in operating assets and liabilities Accounts receivable, net (2,093) 527 Inventories (2.723) 217 Vendor non-trade receivables (4.254) (51) Other current and non-current assets (5.318) 1,055 Accounts payable 9.618 1.837 Deferred revenue (626) 1.554) Other current and non-current liabilities (154) (2.033) Cash generated by operating activities 63.598 65,824 Investing activities Purchases of marketable securities (159,486) (142,428) Proceeds from maturities of marketable securities 31,775 21.258 Proceeds from sales of marketable securities 94,561 90536 Payments made in connection with business acquisitions, net (329) 297) Payments for acquisition of property, plant and equipment (12.451) (12.734) Payments for acquisition of intangible assets (344) (814) (395) (1.388) Payments for strategic investments, net 220 Other (110) (46,446) (45.977) Cash used in investing activities Financing activities: listnmaiinal 417 (238) 3.735) (283 5.001 1.042 9,058 81.266 (166,402) 14538 107,447 143 (11.247 (241) (26) (56.274) Tue Aug 17 9.618 (626) (154) 63,598 1837 (1,554) (2,033) 65.824 5.001 1,042 DIS 81.266 to-cf.media.meducation com Accounts payable Deferred revenue Other current and non-current liabilities Cash generated by operating activities Investing activities Purchases of marketable securities Proceeds from maturities of marketable securities Proceeds from sales of marketable securities Payments made in connection with business acquisitions.net Payments for acquisition of property, plant and equipment Payments for acquisition of intangible assets Payments for strategic investments, net Other Cash used in investing activities Financing activities Proceeds from issuance of common stock Excess tax benefits from equity awards Payments for taxes related to net share settlement of equity awards Payments for dividends and dividend equivalents Repurchases of common stock Proceeds from issuance of term debt, niet Repayments of term det Change in commercial paper.net Cash used in financing activities Increase (decrease) in cash and cash equivalents Cash and cash equivalents, end of the year (159,486) 31.775 94.564 (329) (12.451) (344) (395) 220 (46,446) (142,428) 21.258 90,536 (297) (12,734) (814) (1.388) (110) (45.977) (166.002) 14,538 107.447 343) (11.247) (241) 26 (56.274) 495 555 627 (1.874) (12,769) (32.900) 28.662 (3.500) 3.852 (17347) (195) 20.289 543 740 01.499 (11.561 (35,753 27.114 407 (1.570) (12.150) (29,722) 24.954 (2.500) (397) (20,483) (636) 20,484 2.191 (17,716) 7.276 21.120 S S 5 Supplemental cash flow disclosure Cash paid for income taxes, net Cash paid for interest 11.591 2.092 10.444 1.316 s S 13.252 514 S See accompanying Notes to Consolidated Financial Statements SOM Check my work 7 a. Identify the amounts (in $ millions) of its 2017 (1) assets. (2) liabilities, and (3) equity. (Enter your answers in millions of dollars.) 3.33 DOWY $ 197.295 (1) Assets (2) Liablities (3) Equity b. Using omounts from porta, verity that Annets Les Equity (Enter your answers in millions of dollars) Liabile - Asset 197.200 September 30, 2017 September 24, 2016 S ASSETS Care Cash and cash equivalents Shortmarketable securities Accounts receivable less allowances of $58 and 553, respectively mentories Vendor non-trade receivables Other current Total current assets Long-term marketable securities Property, plant and equipment, net Goodwill Acquired intangible assets, net Other non-current Total 20.289 33.892 17.874 4.855 17.799 13.9365 128,615 194,714 33.783 3.717 2.29 10.16 375319 20.154 18671 15.754 2,132 13.545 X.283 106.80p 17040 27.010 3.414 1.200 757 31.686 LIABILITIES AND SHAREHOLDERS' EQUITY 49.019 25.14 . 11.977 07.19 22,07 KON 105 Acne Accred expenses Deferred mene Commercial paper Creation of wordt "Totul curentiilities Terren Le debe hurrenties Totabilis TV TOXIC X 2.203 IS 1.172 Shurholders' equity Celoni cap al sol. Humode September 26, 2015 S 233,715 140,089 93,626 CONSOLIDATED STATEMENTS OF OPERATIONS (In millions, except number of shares which are reflected in thousands and per share amounts) Years ended September 30, 2017 September 24, 2016 Net sales S 229.234 S 215.639 Cost of sales 141.048 131.376 Gross margin 88,186 84.263 Operating expenses Research and development 11.581 10,045 Selling, general and administrative 15.261 14.194 Total operating expenses 26,842 24.239 Operating income 61.344 60,024 Other income (expense), net 2,745 1,348 Income before provision for income taxes 64.089 61,372 Provision for income taxes 15.738 15,685 Net income 48,351 45,687 8.067 14329 22.396 71.230 1.285 72,515 19.121 53.394 8.35 s S 9.28 9.22 Earnings per share Basic 9.27 Diluted 9.21 $ 8.31 Shares used in computing earnings per share: Basic 5.217.242 5,470,820 Diluted 5.251,692 5,500,281 Cash dividends declared per share 2.40 2.18 See accompanying Notes to Consolidated Financial Statements. 5.753.421 5.793.069 1.98 S Apple Inc. CONSOLIDATED STATEMENTS OF COMPREHENSIVE INCOME (In millions) September 30, 2017 September 24, 2016 Years ended September 26, 2015 53394 55697 September 26, 2015 S 53.394 S (411) 7 2,905 (3.497) Apple Inc. CONSOLIDATED STATEMENTS OF COMPREHENSIVE INCOME (In millions Years ended September 30, 2017 September 24, 2016 Net income 48.351 S 45,687 Other comprehensive income (loss) Change in foreign currency translation, net of tax effects of S(77), 58 and $201. respectively 224 75 Change in unrealized gains/losses on derivative instruments Change in fair value of derivatives, net of tax benefit (expense) of $(478), S(7) and $(441), respectively 1,315 Adjustment for net (gains) losses realized and included in net income, net of tax expense (benefit of $475.5131 and 5630, respectively (1.477) (741) Total change in unrealized gains/losses on derivative instruments, net of tax (162) (734) Change in unrealized gains/losses on marketable securities: Change in fair value of marketable securities, net of tax benefit (expense) of $425, 8(863) and $264, respectively (782) 1.582 Adjustment for net (gains) losses realized and included in net incomie, net of tax expense (benefit) of S35, 5(31), and S(32), respectively (64) 56 Total change in unrealized gains/losses on marketable securities, net of tax (846) 1.638 (784) Total other comprehensive income (loss) 47,567 46,666 Total comprehensive income See accompanying Notes to Consolidated Financial Statements, X592) (483 59 979 (424) (1.427) 51.967 to-cf-media.meducation.com 30% Total Common Stock and Additional Paid-In Capital Retained Shares Amount Earnings 5.866,161 $ 23.313 5 87.152 51194 Accumulated Other Comprehensive Income Shareholders Equity 1.0825 111.547 51.304 (1427) (1427) (11.627) (36,026) 1586 (325,032) (11.627) 36,026) 3.586 37,624 (231) (609) 1840) 748 27.416 5 5.578,7535 748 119.355 (345) 92.284 45,687 45.687 979 (279,609) (12.188) (29.000) Balances as of September 27, 2014 Net income Other comprehensive income (los) Dividends and dividend equivalents declared Repurchase of common stock Share-based compensation Common stock issued, net of shares withheld for employee taxes Tax benefit from equity awards, including transfer pricing adjustments Balances as of September 26, 2015 Net income Other comprehensive income (los) Dividends and dividend equivalents declared Repurchase of common stock Share-based compensation Common stock issued, net of shares withheld for employee taxes Tax benefit from equity awards, including transfer pricing adjustments Balances as of September 24, 2016 Net income Other comprehensive income (loss) Dividends and dividend equivalents declared Repurchase of common stock Share-based compensation Common stock issued, net of shares withheld for employee taxes Tax benefit from equity awards, including transfer pricing adjustments Balances as of September 30, 2017 979 (12.1887 (29.000 4.263 4,262 37.022 (806) (419) (1.225 379 5.336,166 S 31.251s $ 6315 96.36 48.351 (784) 379 128.249 48.351 (784) (12.8033 (33,001) 4,909 (12.803) (33.001) (246,496) 4.909 36.531 (913) (581) (1.494) 620 35,867 S 620 134,017 5,126, 201 98.330S (150) APPLE September 26, 2015 S 13844 53 394 11.257 3.586 1.382 385 Apple Inc. CONSOLIDATED STATEMENTS OF CASH FLOWS (In millions) Years ended September 30, 2017 Cash and cash equivalents, beginning of the year September 24, 2016 20,484 21.120 Operating activities Net income 48,351 45,687 Adjustments to reconcile net income to cash generated by operating activities Depreciation and amortization 10,157 10.505 Share-based compensation expense 4.840 4,210 Deferred income tax expense 5.966 4,938 Other (166) 486 Changes in operating assets and liabilities Accounts receivable, net (2,093) 527 Inventories (2.723) 217 Vendor non-trade receivables (4.254) (51) Other current and non-current assets (5.318) 1,055 Accounts payable 9.618 1.837 Deferred revenue (626) 1.554) Other current and non-current liabilities (154) (2.033) Cash generated by operating activities 63.598 65,824 Investing activities Purchases of marketable securities (159,486) (142,428) Proceeds from maturities of marketable securities 31,775 21.258 Proceeds from sales of marketable securities 94,561 90536 Payments made in connection with business acquisitions, net (329) 297) Payments for acquisition of property, plant and equipment (12.451) (12.734) Payments for acquisition of intangible assets (344) (814) (395) (1.388) Payments for strategic investments, net 220 Other (110) (46,446) (45.977) Cash used in investing activities Financing activities: listnmaiinal 417 (238) 3.735) (283 5.001 1.042 9,058 81.266 (166,402) 14538 107,447 143 (11.247 (241) (26) (56.274) Tue Aug 17 9.618 (626) (154) 63,598 1837 (1,554) (2,033) 65.824 5.001 1,042 DIS 81.266 to-cf.media.meducation com Accounts payable Deferred revenue Other current and non-current liabilities Cash generated by operating activities Investing activities Purchases of marketable securities Proceeds from maturities of marketable securities Proceeds from sales of marketable securities Payments made in connection with business acquisitions.net Payments for acquisition of property, plant and equipment Payments for acquisition of intangible assets Payments for strategic investments, net Other Cash used in investing activities Financing activities Proceeds from issuance of common stock Excess tax benefits from equity awards Payments for taxes related to net share settlement of equity awards Payments for dividends and dividend equivalents Repurchases of common stock Proceeds from issuance of term debt, niet Repayments of term det Change in commercial paper.net Cash used in financing activities Increase (decrease) in cash and cash equivalents Cash and cash equivalents, end of the year (159,486) 31.775 94.564 (329) (12.451) (344) (395) 220 (46,446) (142,428) 21.258 90,536 (297) (12,734) (814) (1.388) (110) (45.977) (166.002) 14,538 107.447 343) (11.247) (241) 26 (56.274) 495 555 627 (1.874) (12,769) (32.900) 28.662 (3.500) 3.852 (17347) (195) 20.289 543 740 01.499 (11.561 (35,753 27.114 407 (1.570) (12.150) (29,722) 24.954 (2.500) (397) (20,483) (636) 20,484 2.191 (17,716) 7.276 21.120 S S 5 Supplemental cash flow disclosure Cash paid for income taxes, net Cash paid for interest 11.591 2.092 10.444 1.316 s S 13.252 514 S See accompanying Notes to Consolidated Financial Statements