some historical information concerning the performance (average returns) and distribution (standard deviation) of returns for selected Australian financial securities (equities / government bonds / short-term commercial bills) for periods up to the start of 2015.
Comment on the performance and distribution of returns for these financial securities on the basis of the recognised direction of the relationship between risk and return that is, did the financial securities perform as expected?As part of your analysis, briefly discuss any specific economic / financial factors that occurred during this period that would have impacted on the performance / distribution of returns for any / all of these financial securities.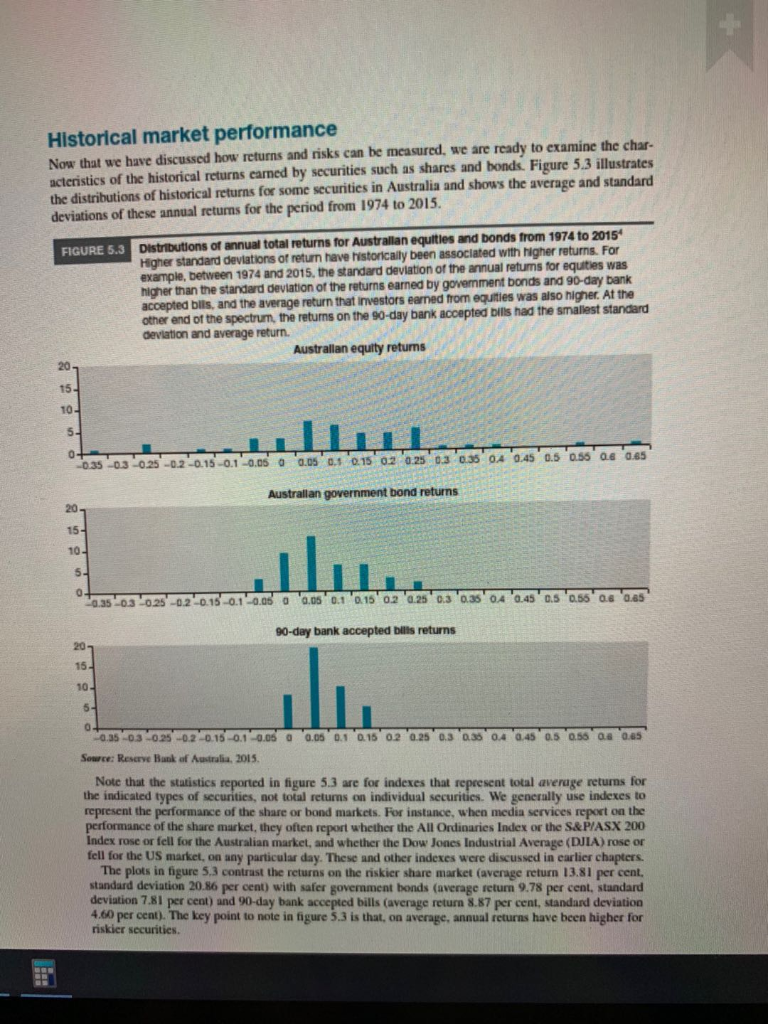
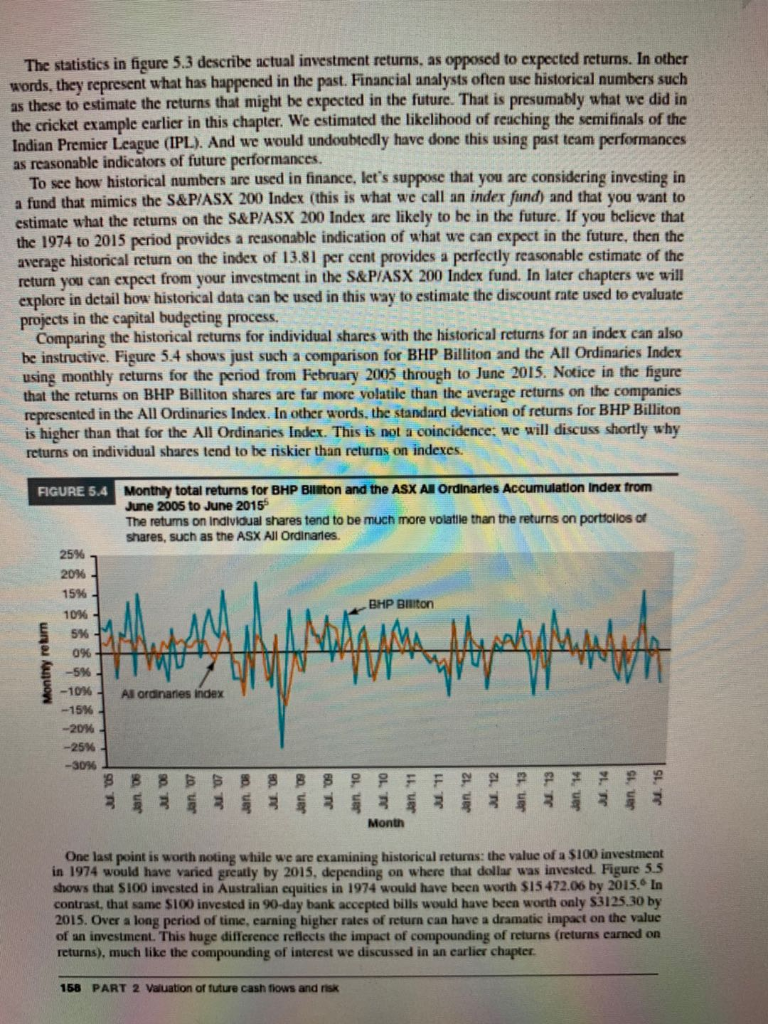
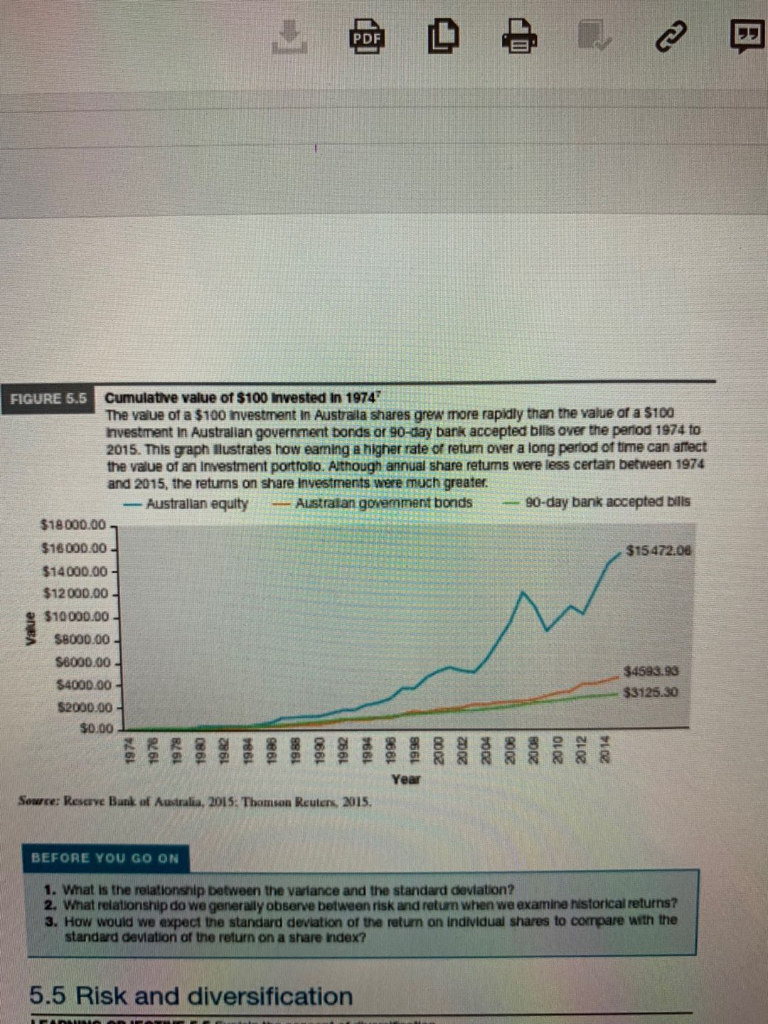
Historical market performance Now that we have discussed how returns and risks can be measured, we are ready to examine the char- acteristics of the historical returns earned by securities such as shares and bonds. Figure 5.3 illustrates the distributions of historical returns for some securities in Australia and shows the average and standard deviations of these annual returns for the period from 1974 to 2015. FIGURE 5.3 Distributions of annual total returns for Australian equities and bonds from 1974 to 2015 Higher standard deviations of return have historically been associated with higher returns. For example, between 1974 and 2015, the standard deviation of the annual retums for equities was higher than the standard deviation of the returns earned by government bonds and 90-day bank accepted bils, and the average return that investors earned from equities was also higher. At the other end of the spectrum, the returns on the 90-day bank accepted bills had the smallest standard deviation and average return. Australian equity returns 20 15 10. 5 ILI -0.35 -0.3 -0.25 -0.2 -0.15-0.1 -0.05 0.5 0.5 0.15 0.2 0.25 0.3 0.35 0.4 0.45 0.5 0.55 0.6 0.65 Australian government bond returns 20 15- 10- 5 20.35 0.15 0.1 0.05 0.05 0.1 0.15 0.2 0.25 0.3 0.35' 04 0.45 0.5 0.550.65 90-day bank accepted bills returns 20- 15 10 LE 5- 0 0.35 0.3-0.25 -0.2 0.16 0.1-0.05 a 0.05 0.1 0.15 0.2 0.25 0.3 0.33 04 0.45 0.5 0.55 0.0 0.0 Source: Reserve Bank of Australia 2015 Note that the statistics reported in figure 5.3 are for indexes that represent total average returns for the indicated types of securities, not total returns on individual securities. We generally indexes to represent the performance of the share or bond markets. For instance, when media services report on the performance of the share market, they often report whether the All Ordinaries Index or the S&P/ASX 200 Index rose or fell for the Australian market, and whether the Dow Jones Industrial Average (DJIA) rose or fell for the US market, on any particular day. These and other indexes were discussed in earlier chapters The plots in figure 5.3 contrast the returns on the riskier share market (avera return 13.81 per cent. standard deviation 20.86 per cent) with safer government bonds (average return 9.78 per cent, standard deviation 7.81 per cent) and 90-day bank accepted bills (average return 8.87 per cent standard deviation 4.60 per cent). The key point to note in figure 5.3 is that, on average, annual returns have been higher for riskier securities HH The statistics in figure 5.3 describe actual investment returns, as opposed to expected returns. In other words, they represent what has happened in the past. Financial analysts often use historical numbers such as these to estimate the returns that might be expected in the future. That is presumably what we did in the cricket example earlier in this chapter. We estimated the likelihood of reaching the semifinals of the Indian Premier League (IPL). And we would undoubtedly have done this using past team performances as reasonable indicators of future performances. To see how historical numbers are used in finance, let's suppose that you are considering investing in a fund that mimics the S&P/ASX 200 Index (this is what we call an index fund) and that you want to estimate what the returns on the S&P/ASX 200 Index are likely to be in the future. If you believe that the 1974 to 2015 period provides a reasonable indication of what we can expect in the future, then the average historical return on the index of 13.81 per cent provides a perfectly reasonable estimate of the return you can expect from your investment in the S&P/ASX 200 Index fund. In later chapters we will explore in detail how historical data can be used in this way to estimate the discount rate used to evaluate projects in the capital budgeting process, Comparing the historical returns for individual shares with the historical returns for an index can also he instructive. Figure 5.4 shows just such a comparison for BHP Billiton and the All Ordinaries Index using monthly returns for the period from February 2005 through to June 2015. Notice in the figure that the returns on BHP Billiton shares are far more volatile than the average returns on the companies represented in the All Ordinaries Index. In other words, the standard deviation of returns for BHP Billiton is higher than that for the All Ordinaries Index. This is not a coincidence, we will discuss shortly why returns on individual shares tend to be riskier than returns on indexes. FIGURE 5.4 Monthly total returns for BHP Biliton and the ASX Al Ordinaries Accumulation Index from June 2005 to June 2015 The retums on individual shares tend to be much more volatile than the returns on portfolios of shares, such as the ASX All Ordinaries 25% 20% 15% BHP Bilton 10% 5% 0% -5% -10% Al ordinares Index -15% -20% -25% -30% 8 8 8 8 8 8 8 8 8 8 8 F F 9 8 7 * * * Month One last point is worth noting while we are examining historical returns: the value of a $100 investment in 1974 would have varied greatly by 2015, depending on where that dollar was invested. Figure 5.5 shows that S100 invested in Australian equities in 1974 would have been worth $15472.06 by 2015. In contrast, that same $100 invested in 90-day bank accepted bills would have been worth only $3125.30 by 2015. Over a long period of time, earning higher rates of return can have a dramatic impact on the value of an investment. This huge difference reflects the impact of compounding of returns (returns carned on returns), much like the compounding of interest we discussed in an earlier chapter. 158 PART 2 Valuation future cash flows and risk PDF FIGURE 5.5 Cumulative value of $100 Invested in 1974 The value of a $100 investment in Australa shares grew more rapidly than the value of a $100 hnvestment in Australian government bonds or 90-day bank accepted bills over the period 1974 to 2015. This graph ilustrates how eaming a higher rate of retum over a long period of time can affect the value of an Investment portfoto. Although annual share retums were less certain between 1974 and 2015, the retums on share Investments were much greater. - Australian equity - Australan government bonds 90-day bank accepted bills $18000.00 $16000.00 $15472.06 $14000.00 $12000.00 $10000.00 SB000.00 S6000.00 $4593.93 S4000.00 $3125.30 $2000.00 $0.00 9881 CO2 2002 2008 802 2010 2012 2014 Year Source: Reserve Bank of Australia, 2015. Thomson Reuters, 2015. BEFORE YOU GO ON 1. What is the relationship between the variance and the standard deviation? 2. What relationship do we generally observe between risk and return when we examine historical returns? 3. How would we expect the standard deviation of the return on individual shares to compare with the standard deviation of the return on a share index? 5.5 Risk and diversification