

Answered step by step
Verified Expert Solution
Question
1 Approved Answer
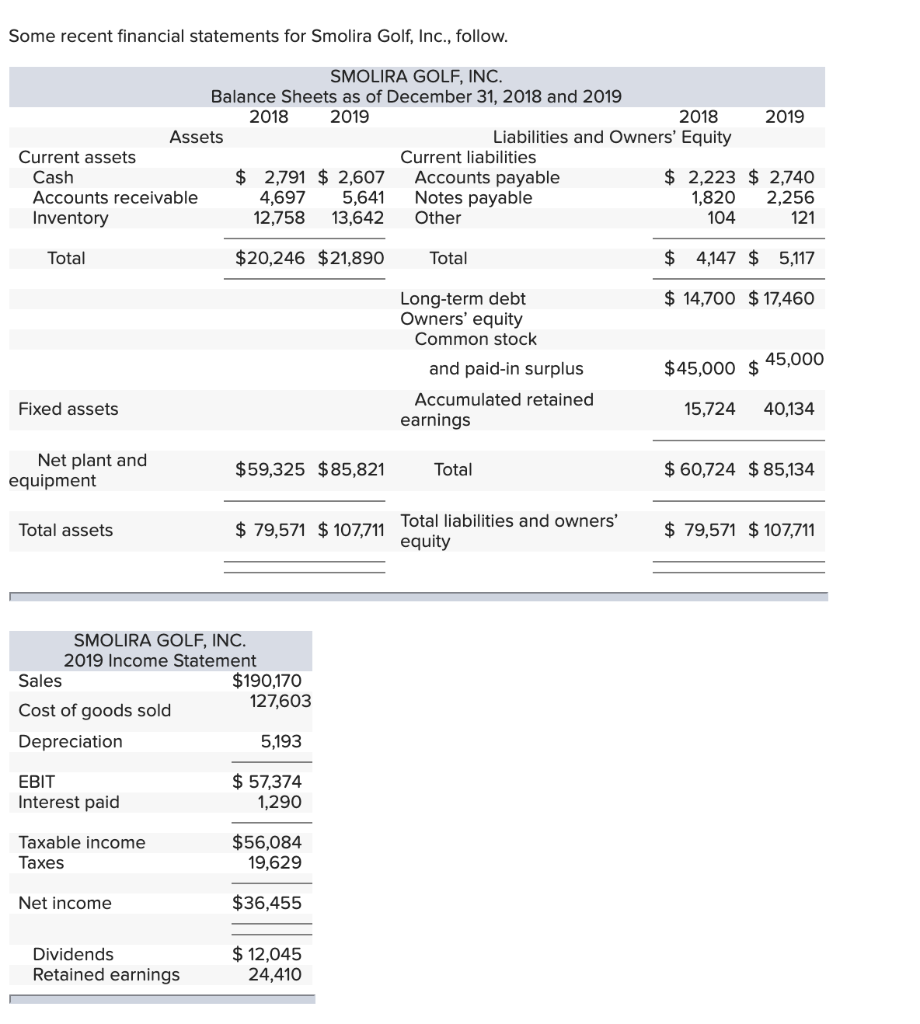
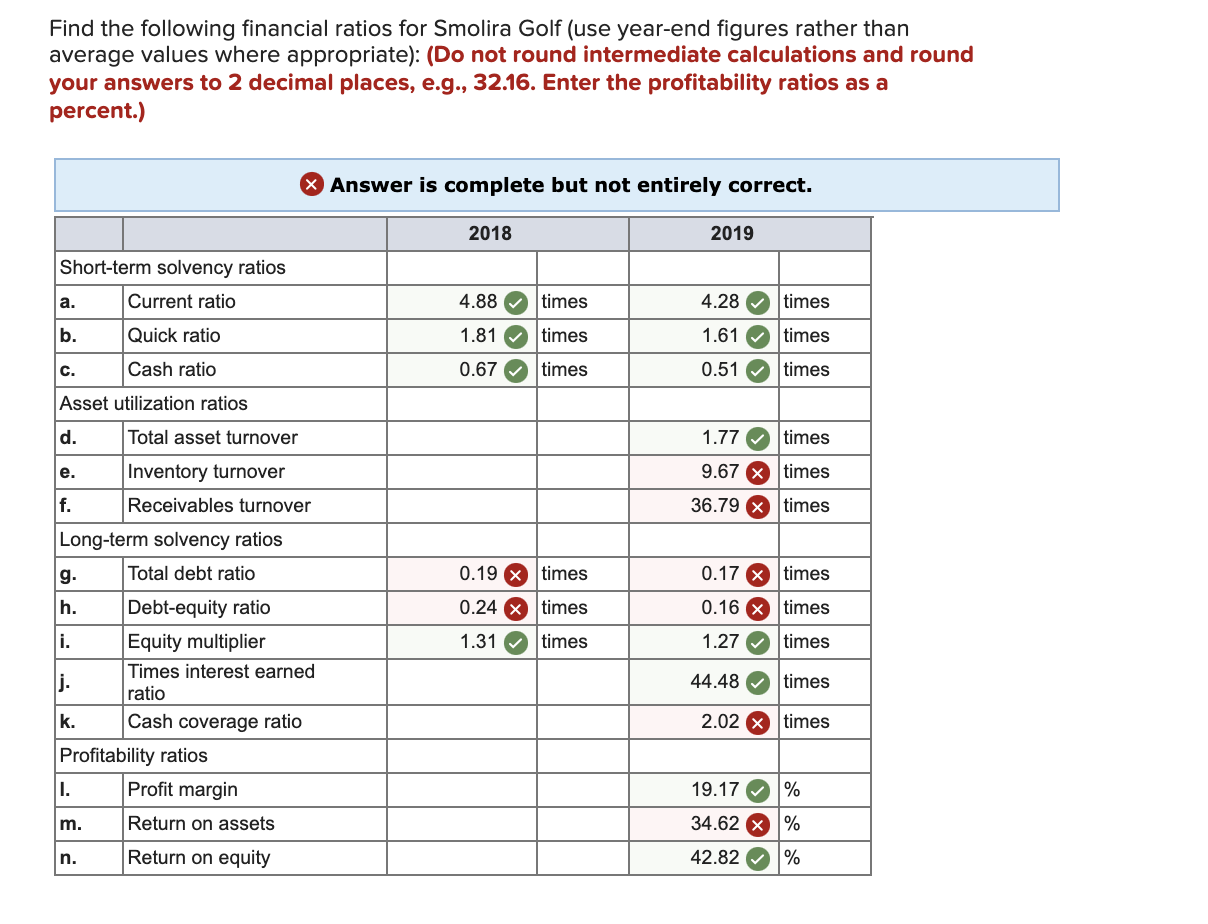
Some recent financial statements for Smolira Golf, Inc., follow. SMOLIRA GOLF, INC. Balance Sheets as of December 31, 2018 and 2019 2018 2019 2018 2019
Step by Step Solution
There are 3 Steps involved in it
Step: 1

Get Instant Access to Expert-Tailored Solutions
See step-by-step solutions with expert insights and AI powered tools for academic success
Step: 2

Step: 3
Ace Your Homework with AI
Get the answers you need in no time with our AI-driven, step-by-step assistance
Get Started
Financial Valuation
Authors: James R. Hitchner
4th Edition
1119286603, 978-1119286608