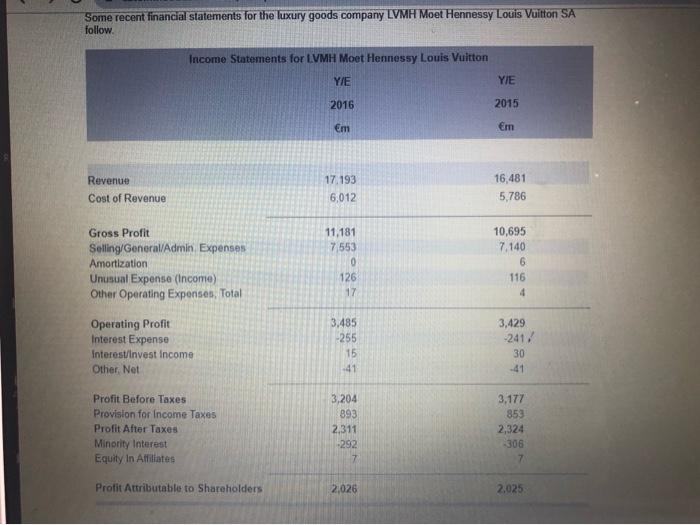
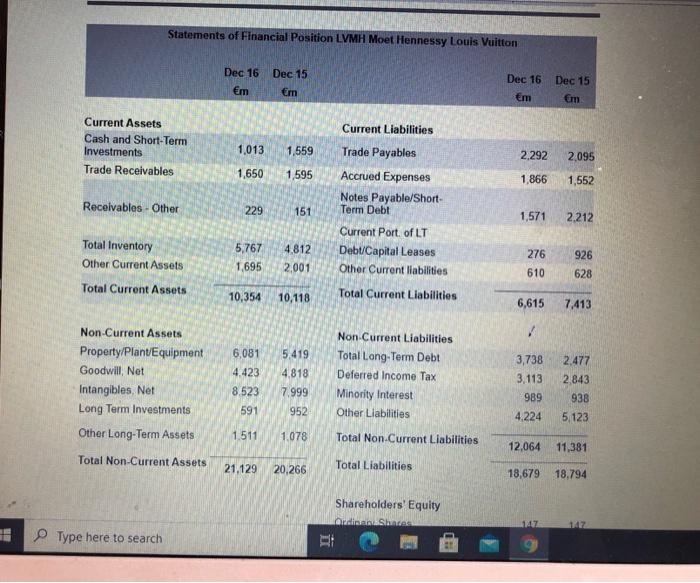
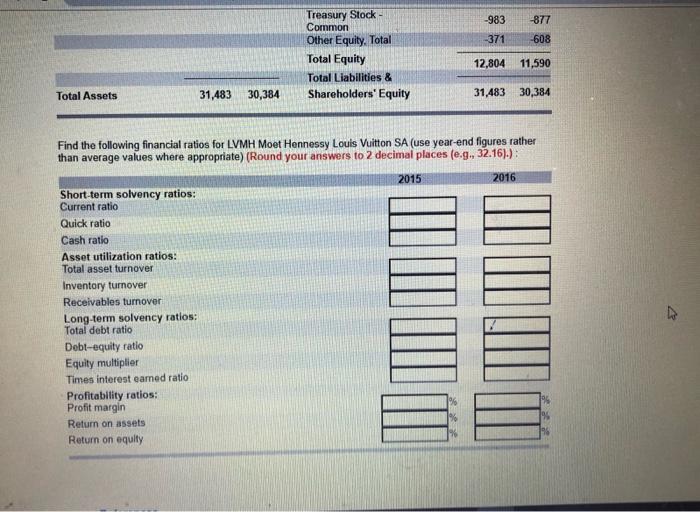
Some recent financial statements for the luxury goods company LVMH Moet Hennessy Louis Vuitton SA follow Income Statements for LVMH Moet Hennessy Louis Vuitton Y/E YIE 2016 2015 em Em Revenue Cost of Revenue 17 193 6,012 16,481 5,786 Gross Profit Seling/General/Admin Expenses Amortization Unusual Expense (Income) Other Operating Expenses. Total 11.181 7553 0 126 17 10,695 7.140 6 116 4 3,429 Operating Profit Interest Expense Interest/Invest Income Other Net 3,485 -255 15 41 -241 30 Profit Before Taxes Provision for Income Taxes Profit After Taxes Minority Interest Equity In Affiliates 3,204 893 2.311 3,177 853 2,324 306 7 292 7 Profit Attributable to Shareholders 2,026 2,025 Statements of Financial Position LVMH Moet Hennessy Louis Vuitton Dec 16 Dec 15 m Em Dec 16 Dec 15 Em Em Current Liabilities Current Assets Cash and Short-Term Investments Trade Receivables 1,013 1,559 2,292 2,095 1,650 1,595 1,866 1,552 Receivables - Other 229 151 Trade Payables Accrued Expenses Notes Payable/Short Term Debt Current Port of LT Debt/Capital Leases Other Current liabilities 1,571 2.212 Total Inventory Other Current Assets 5,767 1,695 4.812 2001 276 610 926 628 Total Current Assets 10,354 10,118 Total Current Liabilities 6,615 7,413 5.419 Non-Current Assets Property/PlantEquipment Goodwill, Net Intangibles, Net Long Term Investments 4.818 6,081 4.423 8.523 591 Non Current Liabilities Total Long-Term Debt Deferred Income Tax Minority Interest Other Liabilities 2,477 2.843 7.999 3,738 3,113 989 4.224 938 952 5,123 Other Long-Term Assets 1.511 1.078 Total Non-Current Liabilities 12.064 11,381 Total Non-Current Assets 21,129 Total Liabilities 20,266 18,679 18.794 Shareholders' Equity Ordi.Shundar 147 Type here to search -983 877 -371 -608 Treasury Stock Common Other Equity. Total Total Equity Total Liabilities & Shareholders' Equity 12,804 11,590 Total Assets 31,483 30,384 31,483 30,384 Find the following financial ratios for LVMH Moet Hennessy Louis Vuitton SA (use year-end figures rather than average values where appropriate) (Round your answers to 2 decimal places (e.g., 32.16).): 2015 2016 Short-term solvency ratios: Current ratio Quick ratio Cash ratio Asset utilization ratios: Total asset turnover Inventory turnover Receivables turnover Long-term solvency ratios: Total debt ratio Debt-equity ratio Equity multiplier Times interest eamed ratio Profitability ratios: Profit margin Return on assets Return on equity


