Someone please help! If possible can whoever answers give a detailed explanation with the answer so I can fully understand. Thank you in advance.
The question is as followed
1.
A. What yearly cash flows are relevant fr this investment decision? Do not forget the effect of taxes and the initial investment amount
B. What discount rate should Worldwide Paper Company (WPC) use to analyze those cash flows? Be prepared to justify your recommended rate and the assumptions that you used to estimate it.
C. What us the net present value (NPV) and internal rate of return (IRR) for the investment?
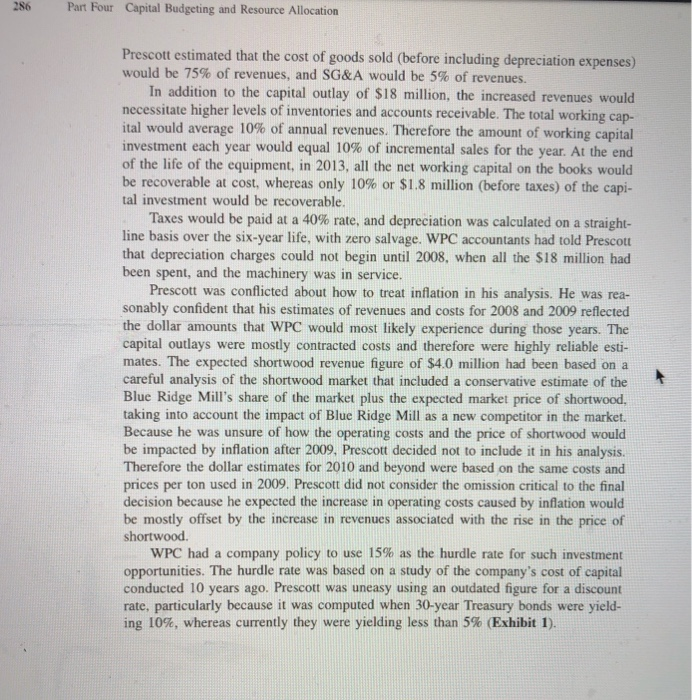
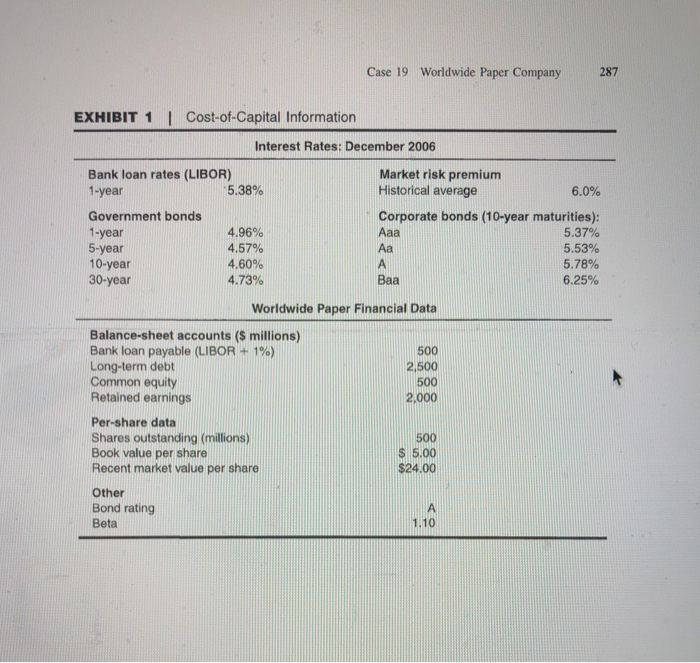
CASE 19 Worldwide Paper Company In December 2006, Bob Prescott, the controller for the Blue Ridge Mill, was consid- ering the addition of a primary benefits: to eliminate the need to purchase shortwood from an outside sup- plier and create the opportunity to sell shortwood on the open market as a new mar- ket for Worldwide Paper Company (WPC). The new woodyard would allow the Blue Ridge Mill not only to reduce its operating costs but also to increase its revenues. The proposed woodyard utilized new technology that allowed tree-length logs, called long- wood, to be processed directly, whereas the current process required shortwood, which had to be purchased from the Shenandoah Mill. This nearby mill, owned by a com- petitor, had excess capacity that allowed it to produce more shortwood than it needed for its own pulp production. The excess was sold to several different mills, including the Blue Ridge Mill. Thus adding the new longwood equipment would mean that Prescott would no longer need to use the Shenandoah Mill as a shortwood supplier and that the Blue Ridge Mill would instead compete with the Shenandoah Mill by selling on the shortwood market. The question for Prescott was whether these expected benefits were enough to justify the $18 million capital outlay plus the incremental investment in working capital over the six-year life of the investment. Construction would start within a few months, and the investment outlay would be spent over two calendar years: $16 million in 2007 and the remaining $2 million in 2008. When the new woodyard began operating in 2008, it would significantly reduce the operating costs of the mill. These operating savings would come mostly from the difference in the cost of producing shortwood on-site versus buying it ket and were estimated to be $2.0 million for 2008 and $3.5 million per year thereafter. Prescott also planned on taking advantage of the excess production capacity afforded by the new facility by selling shortwood on the open market as soon as pos- sible. For 2008, he expected to show revenues of approximately $4 million. facility came on-line and began to break into the new market. He expected shortwood sales to reach $10 million in 2009 and continue at the $10 million level through 2013. ew on-site longwood woodyard. The addition would have two the open mar- on as the This case was prepared by Professor Kenneth M. Eades and is intended for illustrative purposes only. Copyright O 2002 by the University of Virginia Darden School Foundation, Charlottesville, VA. All rights reserved. To order copies, send an e-mail to sales@dardenbusinesspublishing.com. No part of this publica- tion may be reproduced, stored in a retrieval system, used in a spreadsheet, or transmitted in any form or by any means-electronic, mechanical, photocopying, recording, or otherwise-without the permission of the Darden School Foundation. Rev. 9/10. 285 Part Four Capital Budgeting and Resource Allocation 286 Prescott estimated that the cost of goods sold (before including depreciation expenses) would be 75% of revenues, and SG&A would be 5% of revenues. In addition to the capital outlay of $18 million, the increased revenues would necessitate higher levels of inventories and accounts receivable. The total working cap- ital would average 10 % of annual revenues. Therefore the amount of working capital investment each year would equal 10% of incremental sales for the year. At the end of the life of the equipment, in 2013, all the net working capital on the books would at cost, whereas only 10% or $1.8 million (before taxes) of the capi- be recoverable tal investment would be recoverable. Taxes would be paid at a 40 % rate , and depreciation was calculated on line basis over the six-year life, with zero salvage. WPC accountants had told Prescott that depreciation charges could not begin until 2008, when all the $18 million had been spent, and the machinery was in service. a straight- 286 Part Four Capital Budgeting and Resource Allocation Prescott estimated that the cost of goods sold (before including depreciation expenses) would be 75% of revenues, and SG&A would be 5% of revenues. In addition to the capital outlay of $18 million, the increased revenues would necessitate higher levels of inventories and accounts receivable. The total working cap- ital would average 10% of annual revenues. Therefore the amount of working capital investment each year would equal 10% of incremental sales for the year. At the end of the life of the equipment, in 2013, all the net working capital on the books would be recoverable at cost, whereas only 10% or $1.8 million (before taxes) of the capi- tal investment would be recoverable Taxes would be paid at a 40% rate, and depreciation was calculated on a straight- line basis over the six-year life, with zero salvage. WPC accountants had told Prescott that depreciation charges could been spent, and the machinery was in service. Prescott was conflicted about how to treat inflation in his analysis. He was rea- sonably confident that his estimates of revenues and costs for 2008 and 2009 reflected the dollar amounts that WPC would most capital outlays were mostly contracted costs and therefore were highly reliable esti- mates. The expected shortwood revenue figure of $4.0 million had been based on a careful analysis of the shortwood market that included a conservative estimate of the Blue Ridge Mill's share of the market plus the expected market price of shortwood, taking into account the impact of Blue Ridge Mill as a new competitor in the market. Because he was unsure of how the operating costs and the price of shortwood would be impacted by inflation after 2009, Prescott decided not to include it in his analysis. Therefore the dollar estimates for 2010 and beyond were based on the same costs and prices per ton used in 2009. Prescott did not consider the omission critical to the final decision because he expected the increase in operating costs caused by inflation would be mostly offset by the increase in revenues associated with the rise in the price of shortwood. WPC had a company policy to use 159% as the hurdle rate for such investment opportunities. The hurdle rate was based on a study of the company's cost of capital conducted 10 years ago. Prescott was uneasy using an outdated figure for a discount rate, particularly because it was ing 10%, whereas currently they were yielding less than 5% (Exhibit 1). begin until 2008, when all the $18 million had not likely experience during those years. The C computed when 30-year Treasury bonds were yield- Case 19 Worldwide Paper Company 287 EXHIBIT 1 Cost-of-Capital Information Interest Rates: December 2006 Market risk premium Historical average Bank loan rates (LIBOR) 1-year 5.38% 6.0% Corporate bonds (10-year maturities): 5.37% 5.53% 5.78% 6.25% Government bonds 4.96% 1-year 5-year 10-year 30-year Aaa 4.57% Aa A 4.60% 4.73% Baa Worldwide Paper Financial Data Balance-sheet accounts (S millions) Bank loan payable (LIBOR Long-term debt Common equity Retained earnings 1%) 500 2,500 500 2,000 Per-share data Shares outstanding (millions) Book value per share Recent market value per share $ 5.00 $24.00 Other Bond rating Beta A 1.10