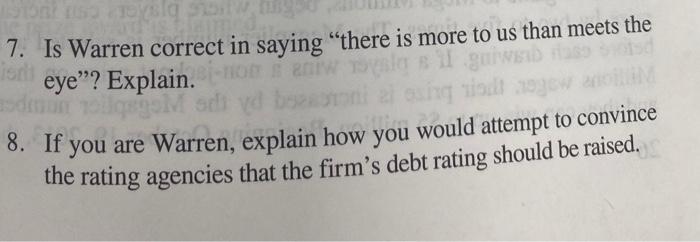
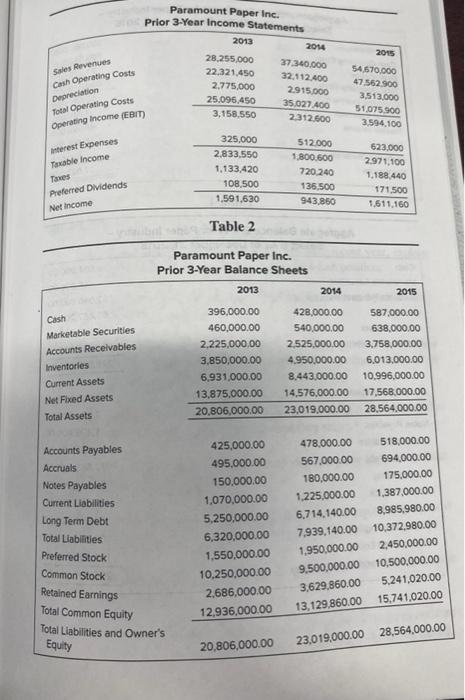
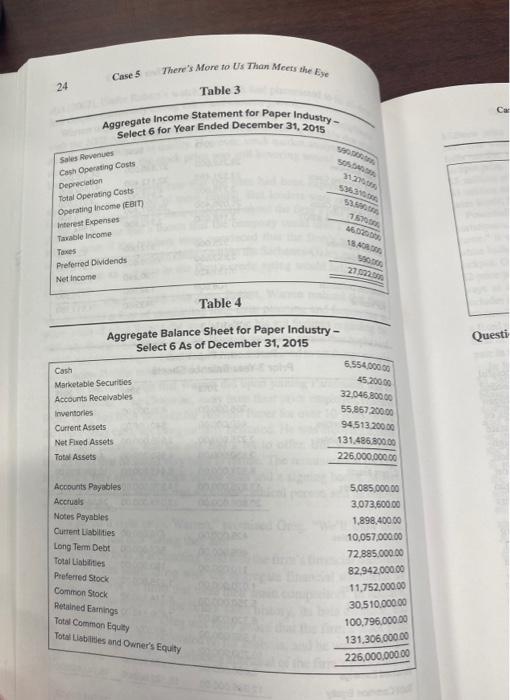
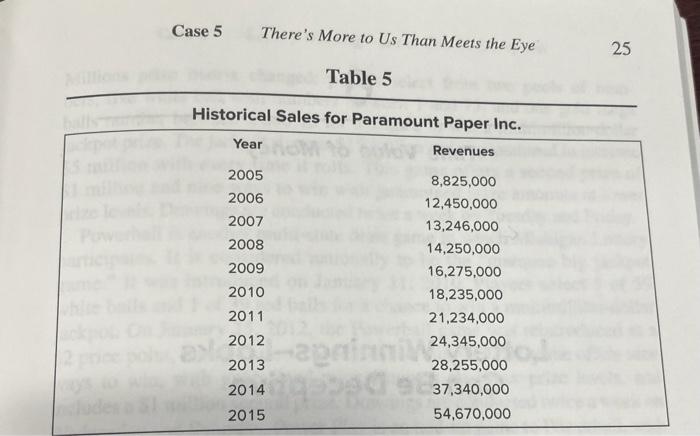
Son 10 51 7. Is Warren correct in saying "there is more to us than meets the is eye"? Explain. Mod 8. If you are Warren, explain how you would attempt to convince the rating agencies that the firm's debt rating should be raised, 2015 Paramount Paper Inc. Prior 3-Year Income Statements 2013 2014 28.255.000 37.340.000 22.321.450 32.112.400 2.775.000 2.915.000 25.096.450 35.027 400 3,158,550 2312.600 54570.000 47.562.900 3,513.000 51.075.900 3.594,100 Sales Revenues Cash Operating costs Depreciation Total Operating costs Operating Income (EBIT interest Expenses Taxable income Taxes Preferred Dividends Net Income 325,000 2,833.550 1.133,420 108,500 1,591,630 512.000 1.800.600 720-240 135.500 943.850 623.000 2.971,100 1.188.440 171.500 1.611.160 Table 2 Paramount Paper Inc. Prior 3-Year Balance Sheets 2013 2014 2015 Cash Marketable Securities Accounts Receivables Inventories Current Assets Net Ficed Assets Total Assets 396,000.00 460,000.00 2.225,000,00 3,850,000.00 6.931,000.00 13,875,000.00 20,806,000.00 428,000.00 540,000.00 2.525,000.00 4.950,000.00 8.443.000.00 14,576,000.00 23.019,000.00 587.000.00 638,000.00 3,758,000.00 6.013,000.00 10.996,000.00 17,568,000.00 28,564,000.00 Accounts Payables Accruals Notes Payables Current Liabilities Long Term Debt Total Liabilities Preferred Stock Common Stock Retained Earnings Total Common Equity Total Liabilities and Owner's Equity 425,000.00 495,000.00 150,000.00 1,070,000.00 5.250,000.00 6,320,000.00 1,550,000.00 10,250,000.00 2,686,000.00 12,936,000.00 478,000.00 567,000.00 180,000.00 1.225.000.00 6,714,140.00 7,939,140.00 1,950,000.00 9.500.000,00 3,629,860.00 13,129,860.00 518,000.00 694,000.00 175,000.00 1,387,000.00 8.985.980.00 10.372.980.00 2,450,000.00 10,500,000.00 5.241,020.00 15.741,020.00 20,806,000.00 23,019,000.00 28,564,000.00 Case 5 There's More to Us Than Meets the Eye Table 3 24 Aggregate Income Statement for Paper Industry- Select 6 for Year Ended December 31, 2015 100 5363 Sales Revues Cash Operating costs Depreciation Total Operating costs Operating Income (EBIT) Interest Expenses Taxable income Taxes Preferred Dividends Net Income 7570 60. 18.A. 27022 Table 4 Questi Aggregate Balance Sheet for Paper Industry - Select 6 As of December 31, 2015 Cash Marketable Securities Accounts Receivables Inventories Current Assets Net Fixed Assets Total Assets 6.554.000.00 45.200.00 32.046 800.00 55.867 20000 94513 20000 131.486,800.00 226.000.000.00 Accounts Payables Actuals Notes Payables Current Liabilities Long Term Debt Total Liabilities Preferred Stock Common Stock 5,085,000.00 3,073,500.00 1,898,400.00 10,057,000.00 72.885.000.00 82.942.000.00 11.752.000.00 30.510.000.00 100.796.000.00 131,306,000.00 225,000,000.00 Retained Earrings Total Common Equity Totatimes and Owner's Equity Case 5 There's More to Us Than Meets the Eye 25 Table 5 Historical Sales for Paramount Paper Inc. Year Revenues 2005 2006 2007 2008 2009 2010 2011 2012 8,825,000 12,450,000 13,246,000 14,250,000 16,275,000 18,235,000 21,234,000 24,345,000 28,255,000 37,340,000 54,670,000 2 2 2013 2014 2015
