

Question
Sora Industries has 62 million outstanding shares, $ 122 million in debt, $ 60 million in cash, and the following projected free cash flow for
Sora Industries has 62 million outstanding shares, $ 122 million in debt, $ 60 million in cash, and the following projected free cash flow for the next four years:
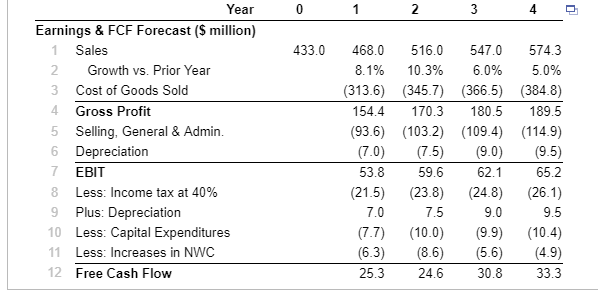
a. Suppose Sora's revenue and free cash flow are expected to grow at a 5.1 % rate beyond year 4. If Sora's weighted average cost of capital is 10.0 %, what is the value of Sora's stock based on this information?
b. Sora's cost of goods sold was assumed to be 67% of sales. If its cost of goods sold is actually 70% of sales, how would the estimate of the stock's value change?
c. Let's return to the assumptions of part (a) and suppose Sora can maintain its cost of goods sold at 67% of sales. However, now suppose Sora reduces its selling, general, and administrative expenses from 20% of sales to 16% of sales. What stock price would you estimate now? (Assume no other expenses, except taxes, are affected.)
d. Sora's net working capital needs were estimated to be 18% of sales (which is their current level in year 0). If Sora can reduce this requirement to 12% of sales starting in year 1, but all other assumptions remain as in part (a), what stock price do you estimate for Sora? (Hint: This change will have the largest impact on Sora's free cash flow in year 1.)
Year 2 Earnings & FCF Forecast (S million) 1 Sales 433.0 468.0 516.0 547.0 574.3 2 Growth vs. Prior Year 8.1% 10.3% 6.0% 5.0% 3 Cost of Goods Sold (313.6) (345.7) (366.5) (384.8) 4 Gross Profit 154.4 170.3 180.5189.5 5 Selling, General & Admin. (93.6) (103.2) 109.4) 114.9) (7.0) (7.5) 9.0) 9.5) 53.8 6 Depreciation 62.1 EBIT 59.6 65.2 8 Less: Income tax at 40% (21.5) (23.8) (24.8) (26.1) 9.5 9 Plus: Depreciation 9.0 10 Less: Capital Expenditures (7.7) (10.0) 9.9) 10.4) (6.3) (8.6) 5.6) (4.9) 33.3 11 Less: Increases in NWC 12 Free Cash Flow 25.3 24.6 30.8 Year 2 Earnings & FCF Forecast (S million) 1 Sales 433.0 468.0 516.0 547.0 574.3 2 Growth vs. Prior Year 8.1% 10.3% 6.0% 5.0% 3 Cost of Goods Sold (313.6) (345.7) (366.5) (384.8) 4 Gross Profit 154.4 170.3 180.5189.5 5 Selling, General & Admin. (93.6) (103.2) 109.4) 114.9) (7.0) (7.5) 9.0) 9.5) 53.8 6 Depreciation 62.1 EBIT 59.6 65.2 8 Less: Income tax at 40% (21.5) (23.8) (24.8) (26.1) 9.5 9 Plus: Depreciation 9.0 10 Less: Capital Expenditures (7.7) (10.0) 9.9) 10.4) (6.3) (8.6) 5.6) (4.9) 33.3 11 Less: Increases in NWC 12 Free Cash Flow 25.3 24.6 30.8Step by Step Solution
There are 3 Steps involved in it
Step: 1

Get Instant Access to Expert-Tailored Solutions
See step-by-step solutions with expert insights and AI powered tools for academic success
Step: 2

Step: 3
Ace Your Homework with AI
Get the answers you need in no time with our AI-driven, step-by-step assistance
Get Started
Liars Poker Rising Through The Wreckage On Wall Street
Authors: Michael Lewis
1st Edition
0393246108,0393247147