

Question
Sorry for the chart organization as 19.6 is mileage and sale price is 28.3 grouped like this and then the next two go along in
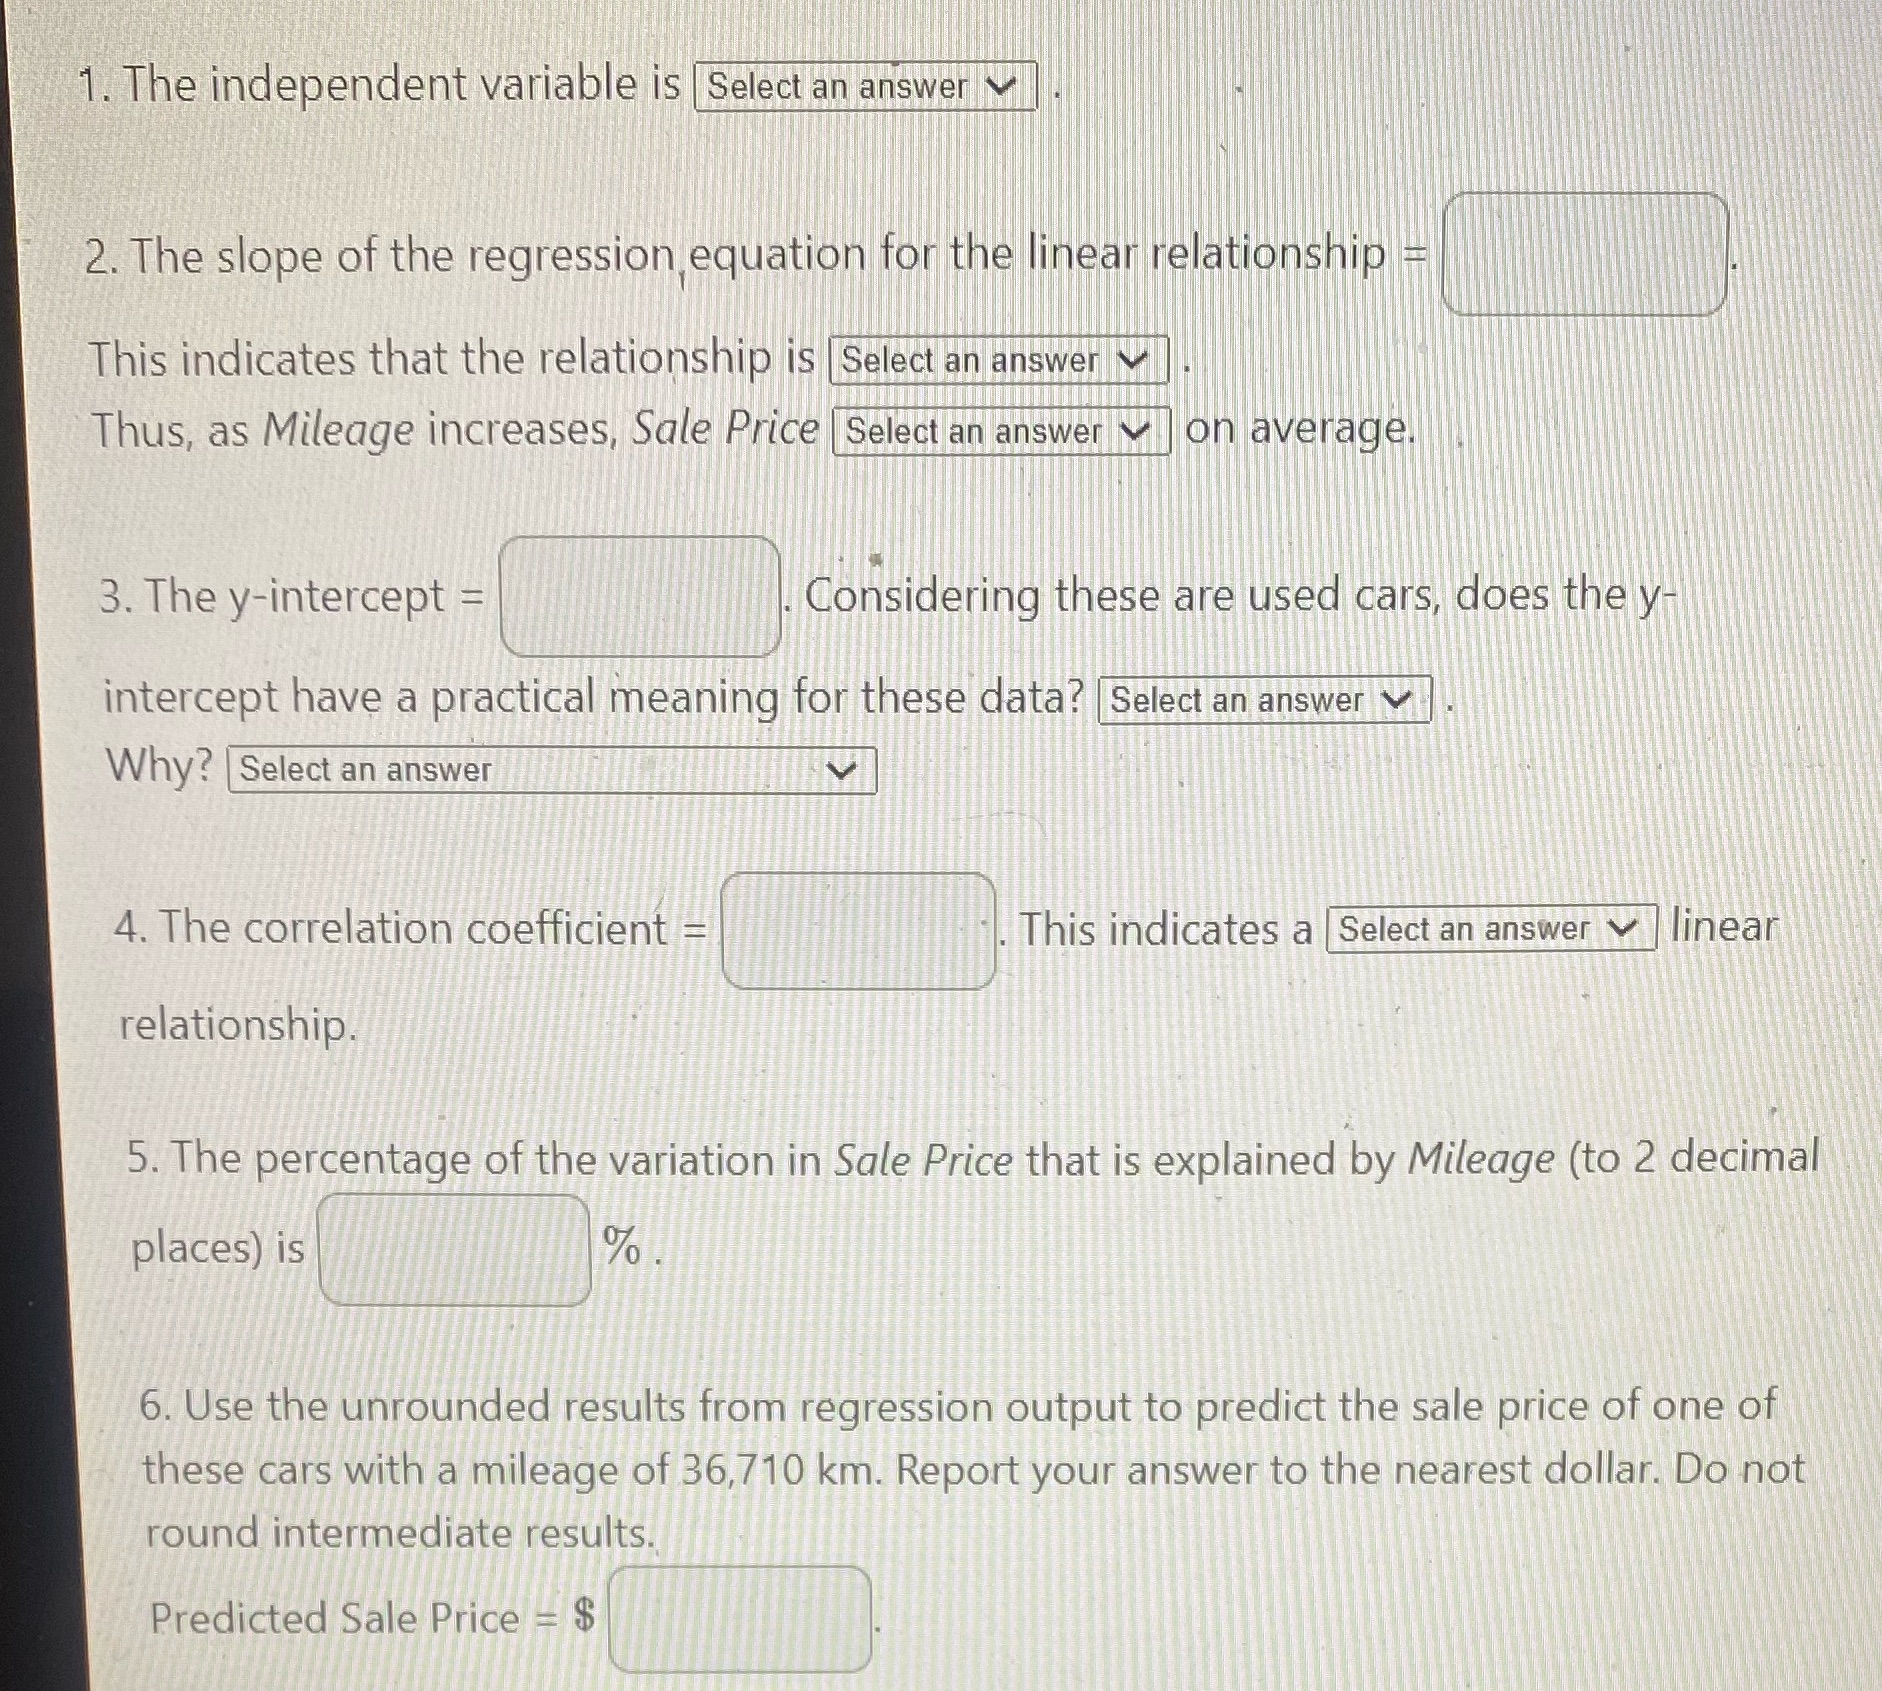
Sorry for the chart organization as 19.6 is mileage and sale price is 28.3 grouped like this and then the next two go along in the same pattern and I have a picture that could only fit in the questions so if you can please answer all questions right as I can not.While investigating how a car's odometer reading (mileage) affects its sale price, a researcher collects data for the sale price of 43 used (preowned) 2020 Nissan Altimas of the same trim level (package). Mileage is in thousands of km and Sale Price is in thousands of dollars. Mileage('000km)Sale_Price($'000)19.628.342.622.022.725.847.024.644.627.738.022.514.929.873.125.074.923.641.228.08.026.340.527.250.527.179.522.475.020.848.725.237.524.59.131.418.027.49.631.331.623.053.323.012.628.85.330.834.022.814.925.840.326.151.726.063.925.840.624.146.523.522.327.039.125.276.320.570.323.245.221.610.326.368.622.340.028.213.930.975.218.653.221.07.125.61. options: milege/ sales price2. First options: strong/very weak/weakegative/positive and Second options: increase/ decrease 3. First options: yes it does/ no it doesn't and Second options: because the slope can't be zero/ because car mileage cant be zero/ because the slope can be negative/ because the intercept can be negative/ because the intercept can be zero 4. Options: neutral/ strong/ weak/ very weak
Step by Step Solution
There are 3 Steps involved in it
Step: 1

Get Instant Access to Expert-Tailored Solutions
See step-by-step solutions with expert insights and AI powered tools for academic success
Step: 2

Step: 3
Ace Your Homework with AI
Get the answers you need in no time with our AI-driven, step-by-step assistance
Get Started
Trigonometry A Unit Circle Approach
Authors: Michael Sullivan
10th Edition
0321999347, 9780321999344