space where an electron can be found. Bohr's most distinctive contribution was the discovery of the link between the quantized energies of electron orbits
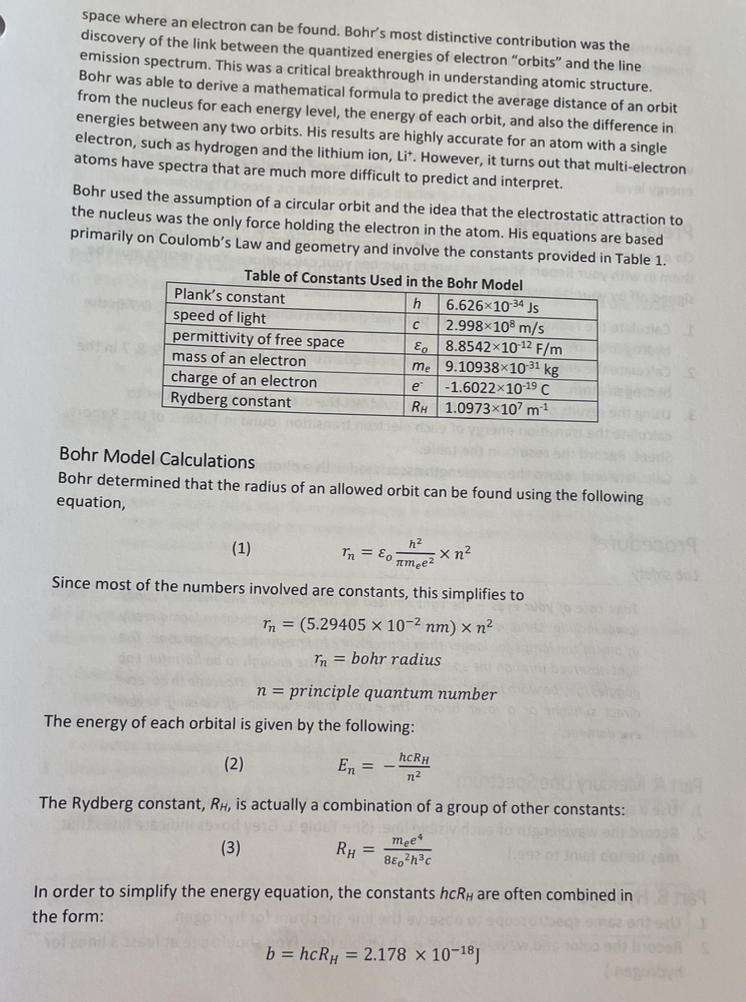
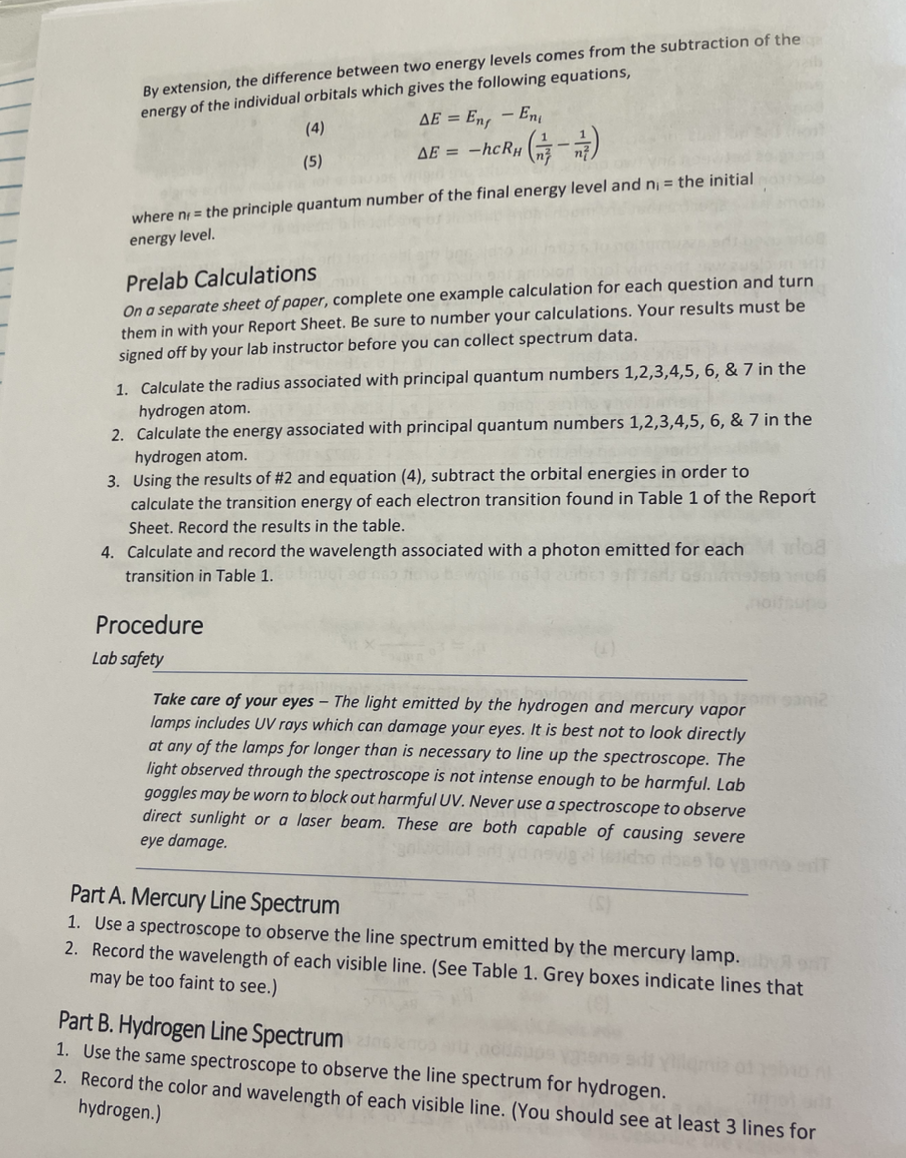
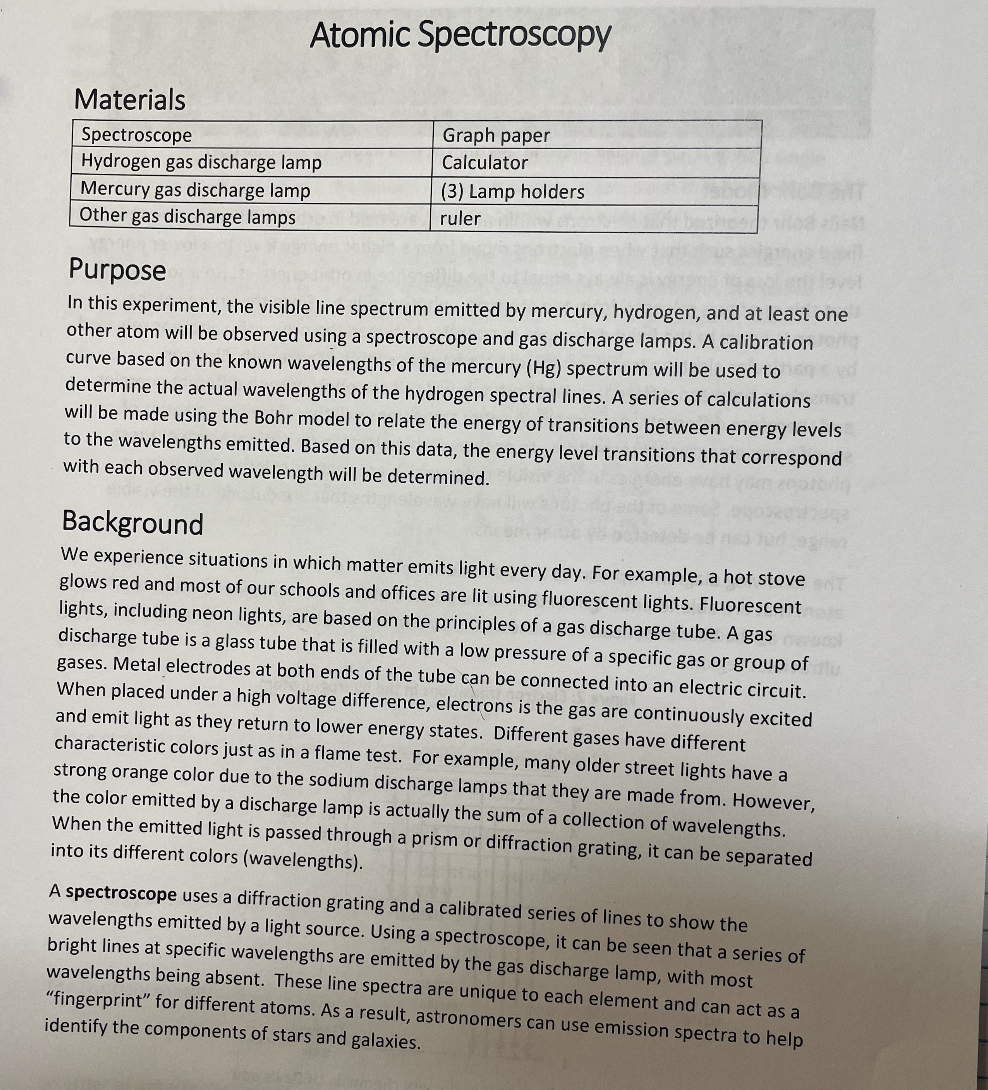
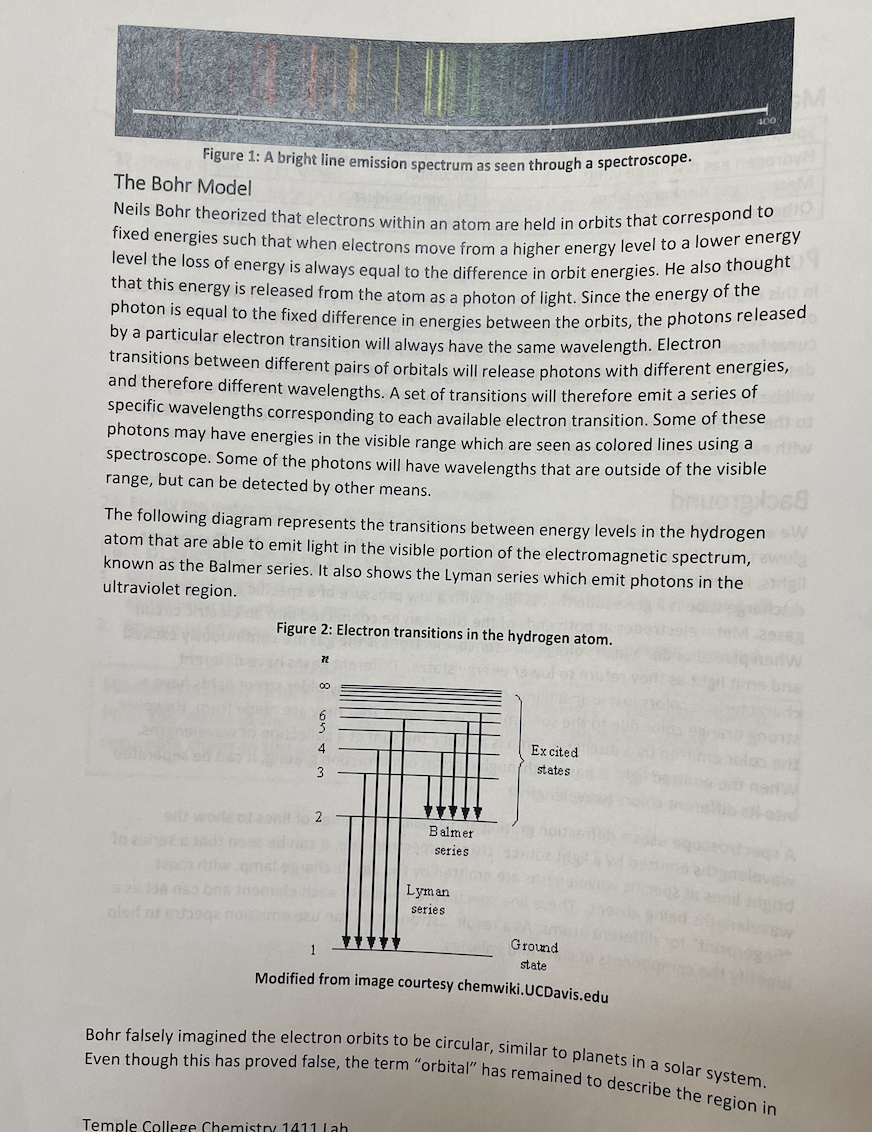
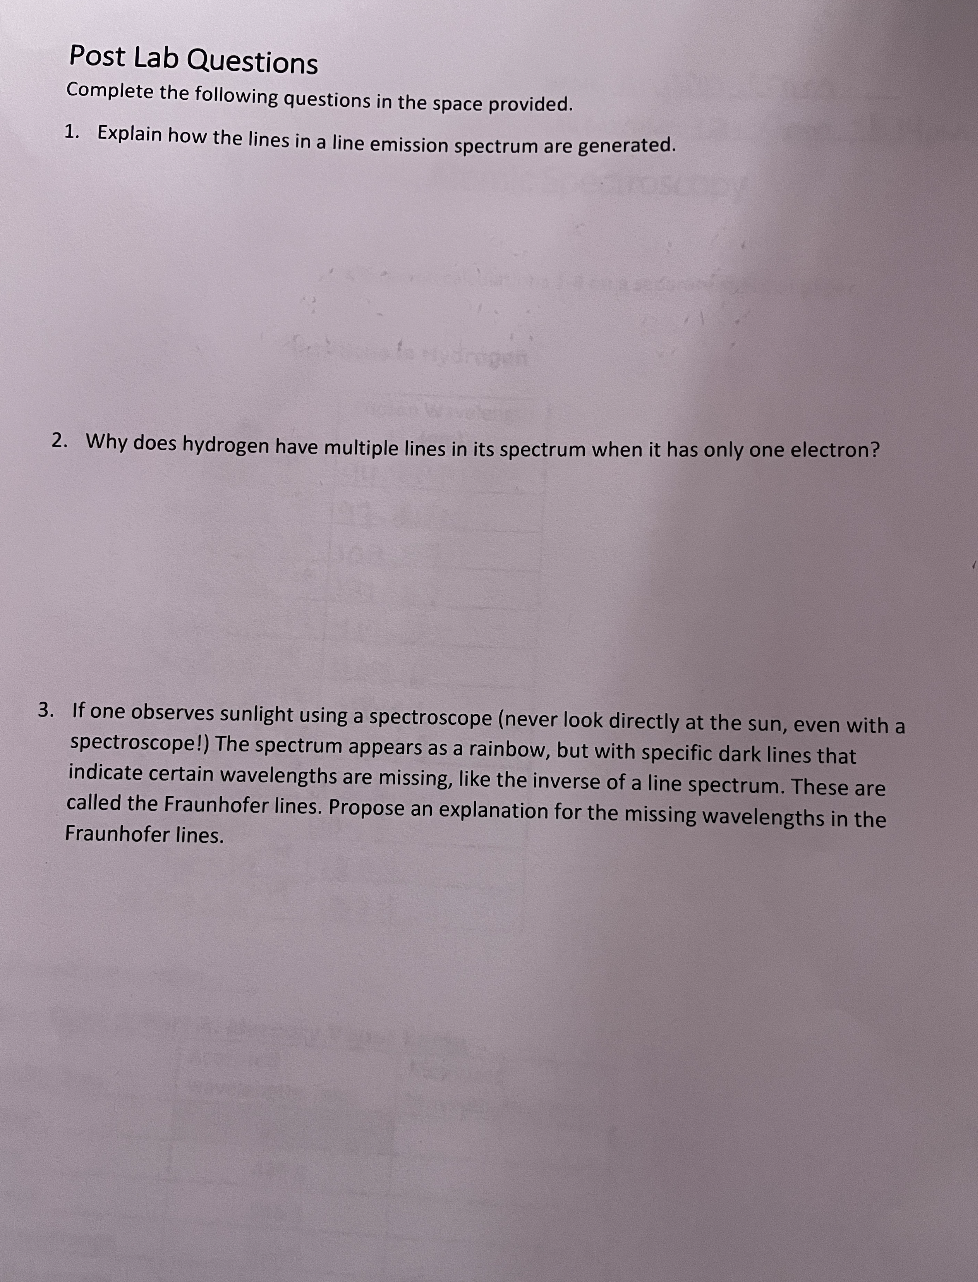
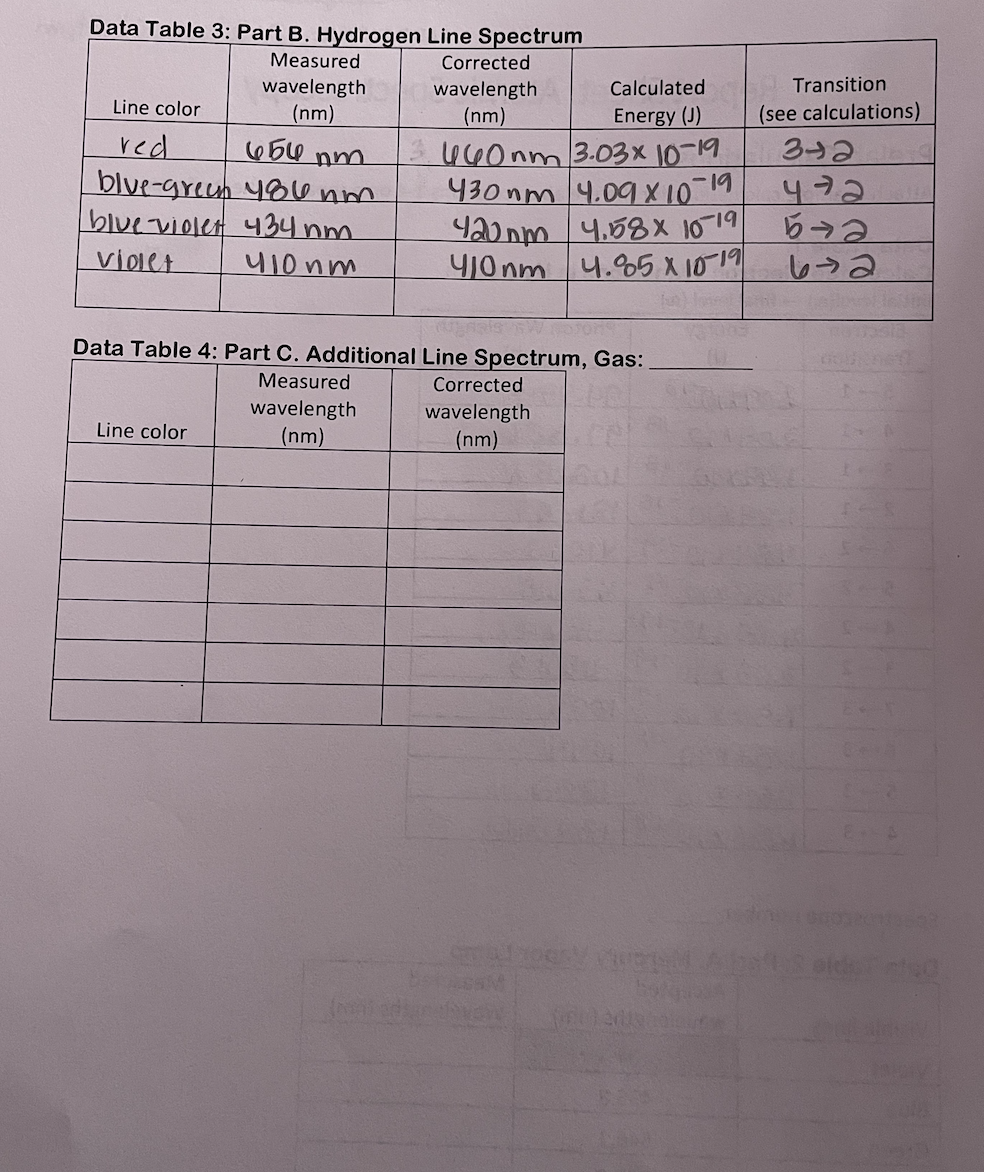
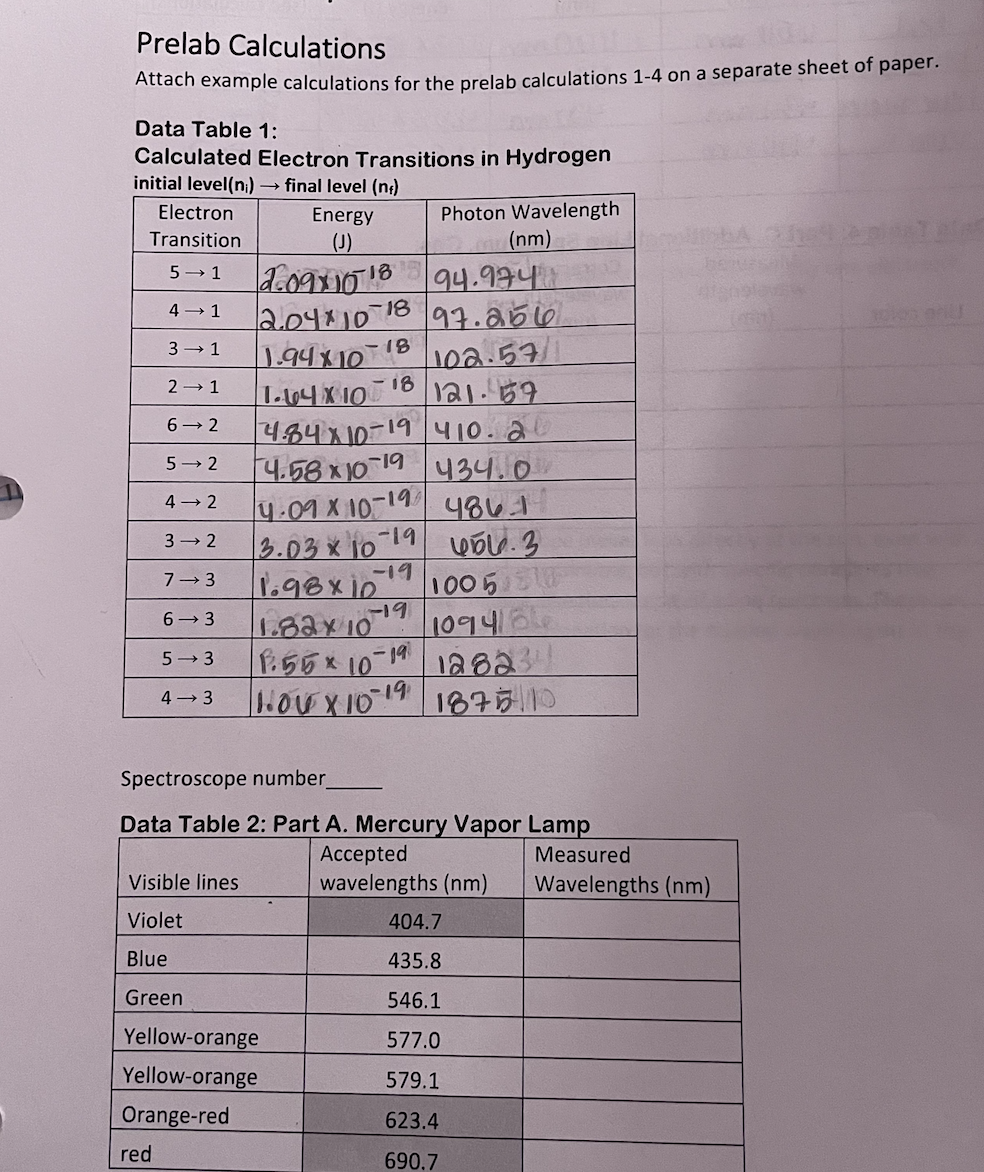
space where an electron can be found. Bohr's most distinctive contribution was the discovery of the link between the quantized energies of electron "orbits" and the line emission spectrum. This was a critical breakthrough in understanding atomic structure. Bohr was able to derive a mathematical formula to predict the average distance of an orbit from the nucleus for each energy level, the energy of each orbit, and also the difference in energies between any two orbits. His results are highly accurate for an atom with a single electron, such as hydrogen and the lithium ion, Lit. However, it turns out that multi-electron atoms have spectra that are much more difficult to predict and interpret. Bohr used the assumption of a circular orbit and the idea that the electrostatic attraction to the nucleus was the only force holding the electron in the atom. His equations are based primarily on Coulomb's Law and geometry and involve the constants provided in Table 1. Table of Constants Used in the Bohr Model Plank's constant h 6.62610-34 Js speed of light C 2.998108 m/s I permittivity of free space E 8.854210-12 F/m mass of an electron me 9.1093810-31 kg S charge of an electron e -1.602210-19 C Rydberg constant RH 1.0973107 m E Bohr Model Calculations Bohr determined that the radius of an allowed orbit can be found using the following equation, (1) h Tn = o xn Since most of the numbers involved are constants, this simplifies to = Tn (5.29405 x 10⁻² nm) x n Tn = bohr radius n = principle quantum number The energy of each orbital is given by the following: (2) En = - hcRH n The Rydberg constant, RH, is actually a combination of a group of other constants: (3) RH = mee4 8802hc In order to simplify the energy equation, the constants hcRH are often combined in the form: b = hRH = 2.178 x 10⁻¹⁸] By extension, the difference between two energy levels comes from the subtraction of the energy of the individual orbitals which gives the following equations, (4) (5) AE = En - Ent AE--hCR = where n = the principle quantum number of the final energy level and n = the initial energy level. Prelab Calculations On a separate sheet of paper, complete one example calculation for each question and turn them in with your Report Sheet. Be sure to number your calculations. Your results must be signed off by your lab instructor before you can collect spectrum data. 1. Calculate the radius associated with principal quantum numbers 1,2,3,4,5, 6, & 7 in the hydrogen atom. 2. Calculate the energy associated with principal quantum numbers 1,2,3,4,5, 6, & 7 in the hydrogen atom. 3. Using the results of #2 and equation (4), subtract the orbital energies in order to calculate the transition energy of each electron transition found in Table 1 of the Report Sheet. Record the results in the table. 4. Calculate and record the wavelength associated with a photon emitted for each transition in Table 1. Procedure Lab safety Take care of your eyes - The light emitted by the hydrogen and mercury vapor lamps includes UV rays which can damage your eyes. It is best not to look directly at any of the lamps for longer than is necessary to line up the spectroscope. The light observed through the spectroscope is not intense enough to be harmful. Lab goggles may be worn to block out harmful UV. Never use a spectroscope to observe direct sunlight or a laser beam. These are both capable of causing severe eye damage. Part A. Mercury Line Spectrum 1. Use a spectroscope to observe the line spectrum emitted by the mercury lamp. ani2 2. Record the wavelength of each visible line. (See Table 1. Grey boxes indicate lines that may be too faint to see.) Part B. Hydrogen Line Spectrum 1. Use the same spectroscope to observe the line spectrum for hydrogen. 2. Record the color and wavelength of each visible line. (You should see at least 3 lines for hydrogen.) Atomic Spectroscopy Materials Spectroscope Hydrogen gas discharge lamp Mercury gas discharge lamp Graph paper Calculator (3) Lamp holders ruler Other gas discharge lamps Purpose In this experiment, the visible line spectrum emitted by mercury, hydrogen, and at least one other atom will be observed using a spectroscope and gas discharge lamps. A calibration o curve based on the known wavelengths of the mercury (Hg) spectrum will be used to determine the actual wavelengths of the hydrogen spectral lines. A series of calculations will be made using the Bohr model to relate the energy of transitions between energy levels to the wavelengths emitted. Based on this data, the energy level transitions that correspond with each observed wavelength will be determined. Background We experience situations in which matter emits light every day. For example, a hot stove glows red and most of our schools and offices are lit using fluorescent lights. Fluorescent lights, including neon lights, are based on the principles of a gas discharge tube. A gas discharge tube is a glass tube that is filled with a low pressure of a specific gas or group of gases. Metal electrodes at both ends of the tube can be connected into an electric circuit. When placed under a high voltage difference, electrons is the gas are continuously excited and emit light as they return to lower energy states. Different gases have different characteristic colors just as in a flame test. For example, many older street lights have a strong orange color due to the sodium discharge lamps that they are made from. However, the color emitted by a discharge lamp is actually the sum of a collection of wavelengths. When the emitted light is passed through a prism or diffraction grating, it can be separated into its different colors (wavelengths). A spectroscope uses a diffraction grating and a calibrated series of lines to show the wavelengths emitted by a light source. Using a spectroscope, it can be seen that a series of bright lines at specific wavelengths are emitted by the gas discharge lamp, with most wavelengths being absent. These line spectra are unique to each element and can act as a "fingerprint" for different atoms. As a result, astronomers can use emission spectra to help identify the components of stars and galaxies. 400 EM Figure 1: A bright line emission spectrum as seen through a spectroscope. The Bohr Model Neils Bohr theorized that electrons within an atom are held in orbits that correspond to fixed energies such that when electrons move from a higher energy level to a lower energy level the loss of energy is always equal to the difference in orbit energies. He also thought that this energy is released from the atom as a photon of light. Since the energy of the photon is equal to the fixed difference in energies between the orbits, the photons released by a particular electron transition will always have the same wavelength. Electron transitions between different pairs of orbitals will release photons with different energies, and therefore different wavelengths. A set of transitions will therefore emit a series of specific wavelengths corresponding to each available electron transition. Some of these photons may have energies in the visible range which are seen as colored lines using a spectroscope. Some of the photons will have wavelengths that are outside of the visible range, but can be detected by other means. The following diagram represents the transitions between energy levels in the hydrogen atom that are able to emit light in the visible portion of the electromagnetic spectrum, known as the Balmer series. It also shows the Lyman series which emit photons in the ultraviolet region. Figure 2: Electron transitions in the hydrogen atom. 72 00 6 2 Balmer series Lyman series Excited of states bre 1 Ground state Modified from image courtesy chemwiki.UCDavis.edu Bohr falsely imagined the electron orbits to be circular, similar to planets in a solar system. Even though this has proved false, the term "orbital" has remained to describe the region in Temple College Chemistry 1411 Lab Post Lab Questions Complete the following questions in the space provided. 1. Explain how the lines in a line emission spectrum are generated. 2. Why does hydrogen have multiple lines in its spectrum when it has only one electron? 3. If one observes sunlight using a spectroscope (never look directly at the sun, even with a spectroscope!) The spectrum appears as a rainbow, but with specific dark lines that indicate certain wavelengths are missing, like the inverse of a line spectrum. These are called the Fraunhofer lines. Propose an explanation for the missing wavelengths in the Fraunhofer lines. Data Table 3: Part B. Hydrogen Line Spectrum Measured wavelength Corrected wavelength Calculated Transition. Line color red (nm) (nm) Energy (J) (see calculations) 654 nm 460nm 3.03x 10⁻¹⁹ 3+2 blue-green 484 nm 430nm 4.09 X 10⁻¹⁹ 472 blue-violet 434 nm 420nm 4.58x 10 19 5 Violet 410nm 410nm 4.85 x 10¹⁹ 672 Data Table 4: Part C. Additional Line Spectrum, Gas: Measured Corrected wavelength wavelength Line color (nm) (nm) Prelab Calculations Attach example calculations for the prelab calculations 1-4 on a separate sheet of paper. Data Table 1: Calculated Electron Transitions in Hydrogen initial level(n) final level (n) Electron Energy Photon Wavelength Transition (J) (nm) 5 1 2.0911018 94.974 4 1 2.04*101 -18 97.256 3 1 -18 1.9410 102.57/1 2 1 6-2 1.64X10 4.8410-19 410.20 -18 121.57 5 2 4.5810-19 434.0 4-2 4.09 x 10⁻¹ -19 4861 3 2 3.03 x 10 -19 7 3 -19 1.98x10 1005 0 6 3 19 1.82x10 1094/66 5 3 1.55 x 10⁻¹⁹ 12823 4 3 10410-19 187510 Spectroscope number Data Table 2: Part A. Mercury Vapor Lamp Accepted Visible lines wavelengths (nm) Violet 404.7 Blue 435.8 Green 546.1 Yellow-orange 577.0 Yellow-orange 579.1 Orange-red 623.4 red 690.7 Measured Wavelengths (nm)
Step by Step Solution
There are 3 Steps involved in it
Step: 1

See step-by-step solutions with expert insights and AI powered tools for academic success
Step: 2

Step: 3

Ace Your Homework with AI
Get the answers you need in no time with our AI-driven, step-by-step assistance
Get Started


