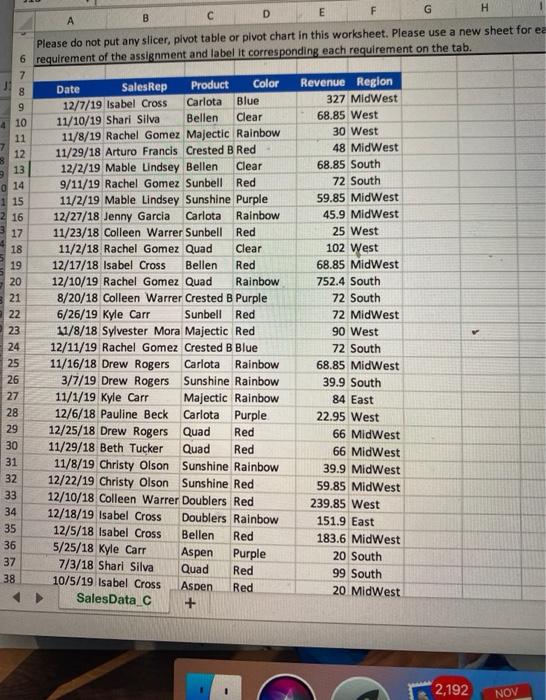
Specification of this Excel Skills Assignment: a. Please name each tab with an appropriate pivot table name. b. The pivot chart must be consistent with the pivot table (categories order) and presented in a professional manner, that is free of unwanted legend, redundant horizontal or vertical axis label, and grid lines. c. The title must reflect the content of the chart. d. The size of the bar or column should be resized so it stands out in the chart. e. Insert the data label on the bar, column, line or the pie chart. Use Excel SalesData to create the pivot tables and pivot charts for the following requirements: 1. Total sales revenue by the bottom 5 sales reps and by product (in the filter). Use bar chart. Sort it from the smallest to the highest in the pivot table. Question: Who has the lowest sales revenue in "Majectric Beaut" product? And the total sales revenue amount? 2. Percentage of sales revenue by region and by Color (in the filter). Use the pie-chart style. Use 2-decimal places Question: Which region has the highest percent sales in "Red" color? And its percentage? 3. Average sales revenue by top 5 products and by region (in the filter). Use the whole number and column chart. Sort it from the largest to the smallest. Question: Name the top product sold in the MidWest region and its average sales revenue. 4. Create a pivot table with 5 categories for the invoice counts. Use the following parameters to group the invoice: starting at 30, ending at 780, and counting by 250. Question: Which group has the highest transactions? And its total transaction count? Grading Rubric: Total: 50 possible points. 1. Delivery Instructions: If not following the instruction, Deduct up to 5 points if the instructions are not fully followed. Zero grade: if submitted by email, or attached corrupted file, or any image file other than the proper Excel file. 2. Pivot Tables Deduct up to 5 points if the generic Row Labels have not been changed. Deduct up to 5 points for not sorted when required Deduct up to 5 points if presented Sum when Average or percentage is required 3. Pivot Charts Deduct up to 5 points if the chart title does not reflect the relevant content Deduct up to 5 points if the chart plot area is not cleaned up including the gridlines, redundant axis labels, no data label, or did not hide the field buttons Deduct up to 5 points if the pivot chart did not reverse the categories order to be consistent with the pivot table. 4. Answers to the questions- deduct one point for each question unanswered or answered incorrectly. H D E F G B Please do not put any slicer, pivot table or pivot chart in this worksheet. Please use a new sheet for ea 6 requirement of the assignment and label it corresponding each requirement on the tab. 7 Date SalesRep Product Color 8 Revenue Region 9 Carlota Blue 12/7/19 Isabel Cross 327 MidWest Bellen Clear 11/10/19 Shari Silva 68.85 West 410 30 West 11 11/8/19 Rachel Gomez Majectic Rainbow 12 11/29/18 Arturo Francis Crested B Red 48 Midwest 13 12/2/19 Mable Lindsey Bellen Clear 68.85 South 14 0 9/11/19 Rachel Gomez Sunbell Red 72 South 1 15 11/2/19 Mable Lindsey Sunshine Purple 59.85 Midwest 16 12/27/18 Jenny Garcia Carlota Rainbow 45.9 Midwest 17 11/23/18 Colleen Warrer Sunbell Red 25 West 18 11/2/18 Rachel Gomez Quad Clear 102 West 19 12/17/18 Isabel Cross Bellen Red 68.85 MidWest 20 12/10/19 Rachel Gomez Quad Rainbow 752.4 South 21 8/20/18 Colleen Warrer Crested B Purple 72 South 6/26/19 Kyle Carr Sunbell Red 72 Midwest 23 11/8/18 Sylvester Mora Majectic Red 90 West 24 12/11/19 Rachel Gomez Crested B Blue 72 South 25 11/16/18 Drew Rogers Carlota Rainbow 68.85 Midwest 26 3/7/19 Drew Rogers Sunshine Rainbow 39.9 South 27 11/1/19 Kyle Carr Majectic Rainbow 84 East 28 12/6/18 Pauline Beck Carlota Purple 22.95 West 29 12/25/18 Drew Rogers Quad Red 66 Midwest 30 11/29/18 Beth Tucker Quad Red 66 Midwest 31 11/8/19 Christy Olson Sunshine Rainbow 39.9 Midwest 32 12/22/19 Christy Olson Sunshine Red 59.85 MidWest 33 12/10/18 Colleen Warrer Doublers Red 239.85 West 34 12/18/19 Isabel Cross Doublers Rainbow 151.9 East 35 12/5/18 Isabel Cross Bellen Red 36 183.6 MidWest 5/25/18 Kyle Carr Aspen Purple 37 20 South 7/3/18 Shari Silva Quad Red 38 99 South 10/5/19 Isabel Cross Aspen Red 20 Midwest Sales Data C + 22 2,192 NOV