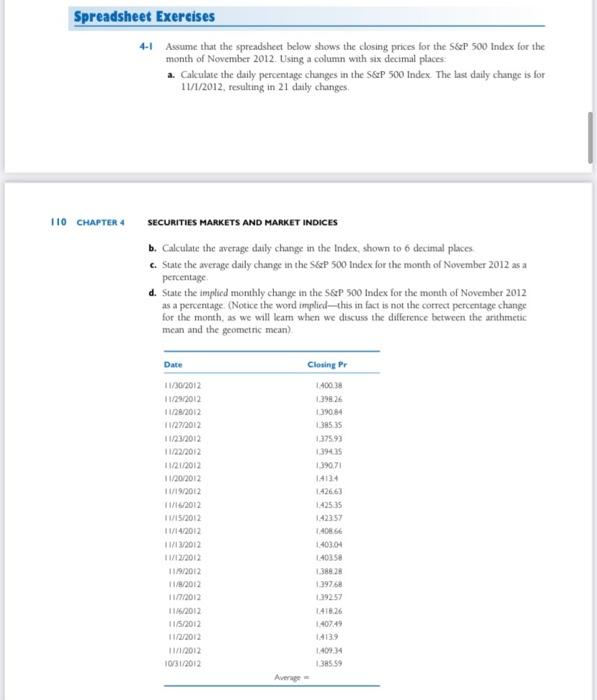
Spreadsheet Exercises 4-1 Assume that the spreadsheet below shows the closing prices for the S&P 500 Index for the month of November 2012. Using a column with six decimal places a. Calculate the daily percentage chunges in the S&P 500 Index. The last daily change is for 11/1/2012, resulting in 21 daily changes 110 CHAPTER 4 SECURITIES MARKETS AND MARKET INDICES b. Calculate the average daily change in the Index, shown to 6 decimal places c. State the average daily change in the S&P 500 Index for the month of November 2012 as a percentage d. State the implied monthly change in the S&P 500 Index for the month of November 2012 as a percentage . (Notice the word impliedthis in fact is not the correct percentage change for the month, as we will leam when we discuss the difference between the arithmetic mean and the geometric mean) Date Closing Pr 140038 1.39926 390.84 138535 137593 11/30/2012 11/29/2012 1128/2012 11/27/2012 11/12/2012 - 11/22/2012 11/21/2012 11/20/2012 11/19/2012 2012 11/15/2012 11/14/2012 11/13/2012 11/12/2012 11/9/2012 11/8/2012 11/2012 11/6/2012 11/5/2012 11/12/2012 11/11/2012 10/31/2012 1.390.71 14124 142663 142535 14233 140866 140304 140358 1.388.28 139768 1418.26 140749 14139 140934 Average Spreadsheet Exercises 4-1 Assume that the spreadsheet below shows the closing prices for the S&P 500 Index for the month of November 2012. Using a column with six decimal places a. Calculate the daily percentage chunges in the S&P 500 Index. The last daily change is for 11/1/2012, resulting in 21 daily changes 110 CHAPTER 4 SECURITIES MARKETS AND MARKET INDICES b. Calculate the average daily change in the Index, shown to 6 decimal places c. State the average daily change in the S&P 500 Index for the month of November 2012 as a percentage d. State the implied monthly change in the S&P 500 Index for the month of November 2012 as a percentage . (Notice the word impliedthis in fact is not the correct percentage change for the month, as we will leam when we discuss the difference between the arithmetic mean and the geometric mean) Date Closing Pr 140038 1.39926 390.84 138535 137593 11/30/2012 11/29/2012 1128/2012 11/27/2012 11/12/2012 - 11/22/2012 11/21/2012 11/20/2012 11/19/2012 2012 11/15/2012 11/14/2012 11/13/2012 11/12/2012 11/9/2012 11/8/2012 11/2012 11/6/2012 11/5/2012 11/12/2012 11/11/2012 10/31/2012 1.390.71 14124 142663 142535 14233 140866 140304 140358 1.388.28 139768 1418.26 140749 14139 140934 Average