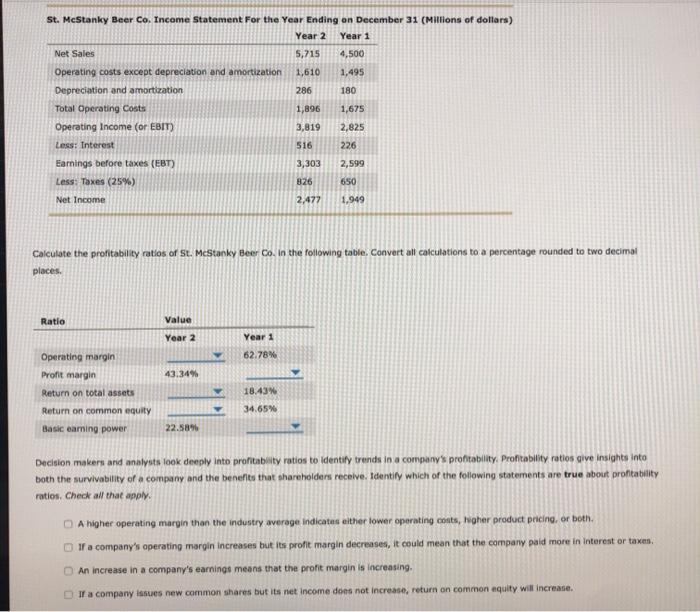
St. McStanky Beer Co. Income Statement For the Year Ending on December 31 (Millions of dollars) Year 2 Year 1 Net Sales 5,715 4,500 Operating costs except depreciation and amortization 1,610 1,495 Depreciation and amortization 286 180 Total Operating costs 1,896 1,675 Operating Income (or EBIT) 3,819 2,825 Less: Interest 516 226 Earnings before taxes (EBT) 3,303 2,599 Less: Taxes (25%) 826 650 Net Income 2.477 1,949 Calculate the profitability ratios of St. McStanky Beer Co. In the following table. Convert all calculations to a percentage rounded to two decimal places. Ratio Value Year 2 Year 1 62.78% 43.34% Operating margin Profit margin Return on total assets Return on common equity Basic eaming power 18.43% 34.65 22.58% Decision makers and analysts look deeply into profitability ratios to identify trends in a company's profitability Profitability ratios give insights into both the survivability of a company and the benefits that shareholders receive. Identity which of the following statements are true about profitability ratios. Check all that apply. A higher operating margin than the industry average indicates either lower operating costs, higher product pricing, or botn. O a company's operating margin increases but its profit margin decreases, it could mean that the company paid more in Interest or taxes An increase in a company's earnings means that the profit margin is increasing Ir a company issues new common shares but its net income does not increase return on common equity will increase. St. McStanky Beer Co. Income Statement For the Year Ending on December 31 (Millions of dollars) Year 2 Year 1 Net Sales 5,715 4,500 Operating costs except depreciation and amortization 1,610 1,495 Depreciation and amortization 286 180 Total Operating costs 1,896 1,675 Operating Income (or EBIT) 3,819 2,825 Less: Interest 516 226 Earnings before taxes (EBT) 3,303 2,599 Less: Taxes (25%) 826 650 Net Income 2.477 1,949 Calculate the profitability ratios of St. McStanky Beer Co. In the following table. Convert all calculations to a percentage rounded to two decimal places. Ratio Value Year 2 Year 1 62.78% 43.34% Operating margin Profit margin Return on total assets Return on common equity Basic eaming power 18.43% 34.65 22.58% Decision makers and analysts look deeply into profitability ratios to identify trends in a company's profitability Profitability ratios give insights into both the survivability of a company and the benefits that shareholders receive. Identity which of the following statements are true about profitability ratios. Check all that apply. A higher operating margin than the industry average indicates either lower operating costs, higher product pricing, or botn. O a company's operating margin increases but its profit margin decreases, it could mean that the company paid more in Interest or taxes An increase in a company's earnings means that the profit margin is increasing Ir a company issues new common shares but its net income does not increase return on common equity will increase