

Question: Staffing with the M/M/s Queue McNeese is determining the staffing level for their credit union located within the university, and has recently hired two tellers
Staffing with the M/M/s Queue
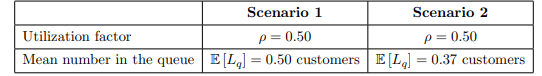
McNeese is determining the staffing level for their credit union located within the university, and has recently hired two tellers (servers). The beginning of the fall semester is their busiest time, with incoming freshmen and transfer students opening accounts. On average, it takes a teller E [T] = 10 minutes to successfully open an account and the average arrival rate has been = 6 per hour. As always, we use the exponential distribution as a reasonable approximation for both the interarrival and service times. After meeting with McNeeses upper administration, the manager of the credit union is considering two possible scenarios for the service layout: Scenario 1: two M/M/1 (dedicated) queues that each serve /2 arrivals Scenario 2: one M/M/2 (pooled) queue that serves all arrivals A queuing analysis was conducted on each scenario, and the results are as follows:
1. For Scenario 1, what is the average time in line (minutes) for a customer?
2. Derive the average time (minutes) spent in the system for Scenario 1.
3. Now calculate the average time in line (minutes) for Scenario 2. Compared to question one, what did you find?
4. Considering Scenario 2, what is the average time (minutes) spent in the system? (a) 5 minutes (b) 9 minutes (c) 11 minutes (d) 14 minutes
5. The credit union is now considering staffing based on a service level of 95% (that is, a delay probability of only five percent). What is the optimal number of tellers to staff?
6. Considering the optimal staffing level, what is the average number of customers in the system
7. Considering the optimal staffing level, what is the average time (minutes) spent in the system? (a) 5 minutes (b) 9 minutes (c) 11 minutes (d) 14 minutes
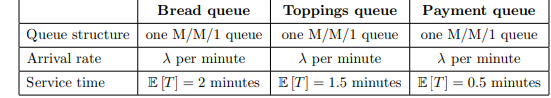
2 Tandem Queues Subway (located near the McNeese campus) is analyzing its simplified, three-step process for a given time period. A customer arrives and waits in the bread queue (where a single server in an M/M/1 layout prepares the bread, meat, and cheese), then proceeds to an M/M/1 toppings queue (toppings and wrapping the completed sandwich), and finally ends in an M/M/1 payment queue (packaging and payment) before exiting the system. The manager has provided us with an arrival rate of = 0.4 customers per minute and the following metrics:
8. What is the mean service rate bread (in customers per minute) for the bread queue? How about the mean number of customers in line for the bread queue, E [Lq, bread]?
9. Determine the distribution of the variable Lbread for the bread queue. What are the descriptive statistics (mean E [Lbread] and standard deviation Lbread ) for the average number of customers (waiting and being served) at this bread queue? (Hint: think back to the geometric distribution from module two.)
10. What is the probability of less than or equal to three customers in the system, P (Lbread 3), for the bread queue? (Hint: since you determined the distribution to be geometric in question nine, just use the properties of this type of distribution from module two.)
11. What is the average number of customers in the three-step process (bread queue, toppings queue, and payment queue), E [Lbread + Ltoppings + Lpayment]? Here, Im using this notation instead of the generalized E [L] from the two-step McDonalds example (see the extra problems file), but it means the same thing.
12. How long does an average customer spend in the three-step process (in minutes) from the time they arrive, E [Wbread + Wtoppings + Wpayment]?
Please solve all the questions and show all the steps. Thank You!
\begin{tabular}{|l|c|c|} \hline & Scenario 1 & Scenario 2 \\ \hline Utilization factor & =0.50 & =0.50 \\ \hline Mean number in the queue & E[Lq]=0.50 customers & E[Lq]=0.37 customers \\ \hline \end{tabular} \begin{tabular}{|l|c|c|c|} & Bread queue & Toppings queue & Payment queue \\ \hline Queue structure & one M/M/1 queue & one M/M/1 queue & one M/M/1 queue \\ \hline Arrival rate & per minute & per minute & per minute \\ \hline Service time & E[T]=2 minutes & E[T]=1.5 minutes & E[T]=0.5 minutes \\ \hline \end{tabular}
Step by Step Solution
There are 3 Steps involved in it

Get step-by-step solutions from verified subject matter experts