Answered step by step
Verified Expert Solution
Question
1 Approved Answer
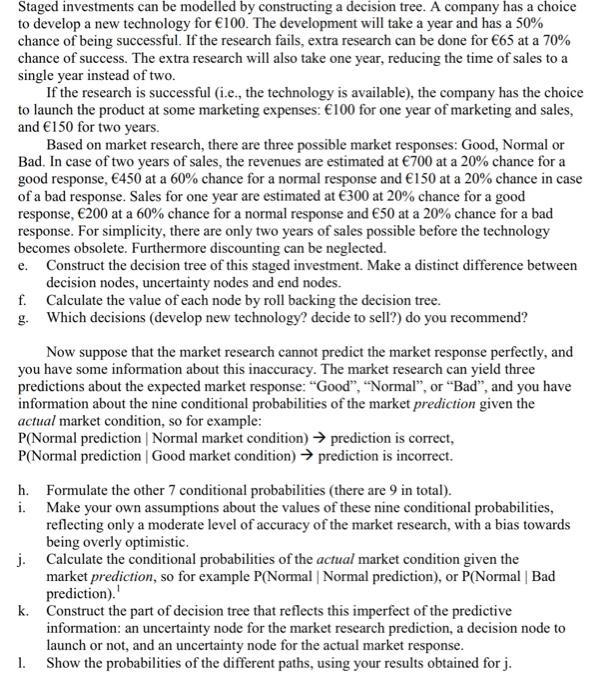
Staged investments can be modelled by constructing a decision tree. A company has a choice to develop a new technology for 100. The development

Staged investments can be modelled by constructing a decision tree. A company has a choice to develop a new technology for 100. The development will take a year and has a 50% chance of being successful. If the research fails, extra research can be done for 65 at a 70% chance of success. The extra research will also take one year, reducing the time of sales to a single year instead of two. If the research is successful (i.e., the technology is available), the company has the choice to launch the product at some marketing expenses: 100 for one year of marketing and sales, and 150 for two years. Based on market research, there are three possible market responses: Good, Normal or Bad. In case of two years of sales, the revenues are estimated at 700 at a 20% chance for a good response, 450 at a 60% chance for a normal response and 150 at a 20% chance in case of a bad response. Sales for one year are estimated at 300 at 20% chance for a good response, 200 at a 60% chance for a normal response and 50 at a 20% chance for a bad response. For simplicity, there are only two years of sales possible before the technology becomes obsolete. Furthermore discounting can be neglected. e. Construct the decision tree of this staged investment. Make a distinct difference between decision nodes, uncertainty nodes and end nodes. f. g. Calculate the value of each node by roll backing the decision tree. Which decisions (develop new technology? decide to sell?) do you recommend? Now suppose that the market research cannot predict the market response perfectly, and you have some information about this inaccuracy. The market research can yield three predictions about the expected market response: "Good", "Normal", or "Bad", and you have information about the nine conditional probabilities of the market prediction given the actual market condition, so for example: P(Normal prediction | Normal market condition) prediction is correct, P(Normal prediction | Good market condition) prediction is incorrect. h. Formulate the other 7 conditional probabilities (there are 9 in total). i. Make your own assumptions about the values of these nine conditional probabilities, reflecting only a moderate level of accuracy of the market research, with a bias towards being overly optimistic. j. Calculate the conditional probabilities of the actual market condition given the market prediction, so for example P(Normal | Normal prediction), or P(Normal | Bad prediction). k. Construct the part of decision tree that reflects this imperfect of the predictive information: an uncertainty node for the market research prediction, a decision node to launch or not, and an uncertainty node for the actual market response. Show the probabilities of the different paths, using your results obtained for j. 1.
Step by Step Solution
There are 3 Steps involved in it
Step: 1
e Here is the decision tree for the staged investment with decision nodes squares uncertainty nodes ...
Get Instant Access to Expert-Tailored Solutions
See step-by-step solutions with expert insights and AI powered tools for academic success
Step: 2

Step: 3

Ace Your Homework with AI
Get the answers you need in no time with our AI-driven, step-by-step assistance
Get Started


