Answered step by step
Verified Expert Solution
Link Copied!

Question

1 Approved Answer

Standard deviation is missing Ch 11 Homework Problems Saved Help Save & Exit Submit Check my work mode: This shows what is correct or incorrect
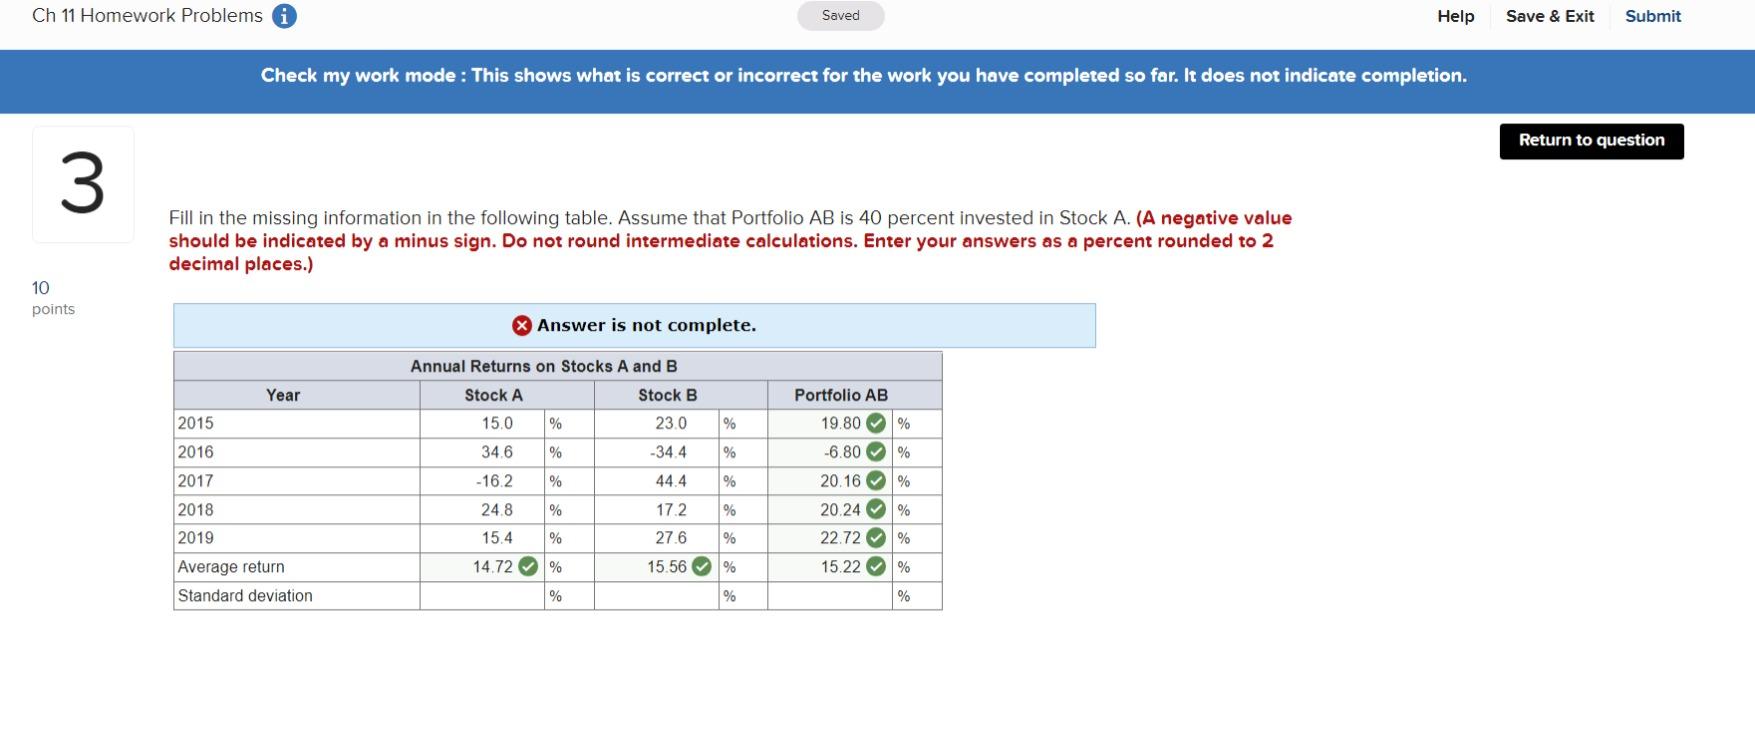
image text in transcribedStandard deviation is missing

Ch 11 Homework Problems Saved Help Save & Exit Submit Check my work mode: This shows what is correct or incorrect for the work you have completed so far. It does not indicate completion. Return to question 3 Fill in the missing information in the following table. Assume that Portfolio AB is 40 percent invested in Stock A. (A negative value should be indicated by a minus sign. Do not round intermediate calculations. Enter your answers as a percent rounded to 2 decimal places.) 10 points X Answer is not complete. Year Annual Returns on Stocks A and B Stock A Stock B 15.0 % 23.0 Portfolio AB 19.80 % 2015 % 34.6 % -34.4 % 2016 2017 -16.2 % 44.4 % -6.80 % 20.16 % 20.24% 24.8 % 17.2 % 2018 2019 15.4 % 27.6 % 22.72 % 14.72% 15.56% 15.22% Average return Standard deviation % % %

Step by Step Solution

There are 3 Steps involved in it

Step: 1

blur-text-image

Get Instant Access to Expert-Tailored Solutions

See step-by-step solutions with expert insights and AI powered tools for academic success

Step: 2

blur-text-image_2

Step: 3

blur-text-image_3

Ace Your Homework with AI

Get the answers you need in no time with our AI-driven, step-by-step assistance

Get Started

Recommended Textbook for

Essential Personal Finance A Practical Guide For Students

Authors: Lien Luu, Jonquil Lowe, Jason Butler, Tony Byrne

1st Edition

1138692956, 978-1138692954

More Books

Students also viewed these Finance questions

Question

6. Explain the power of labels.

Answered: 1 week ago

Question

10. Discuss the complexities of language policies.

Answered: 1 week ago