

Answered step by step
Verified Expert Solution
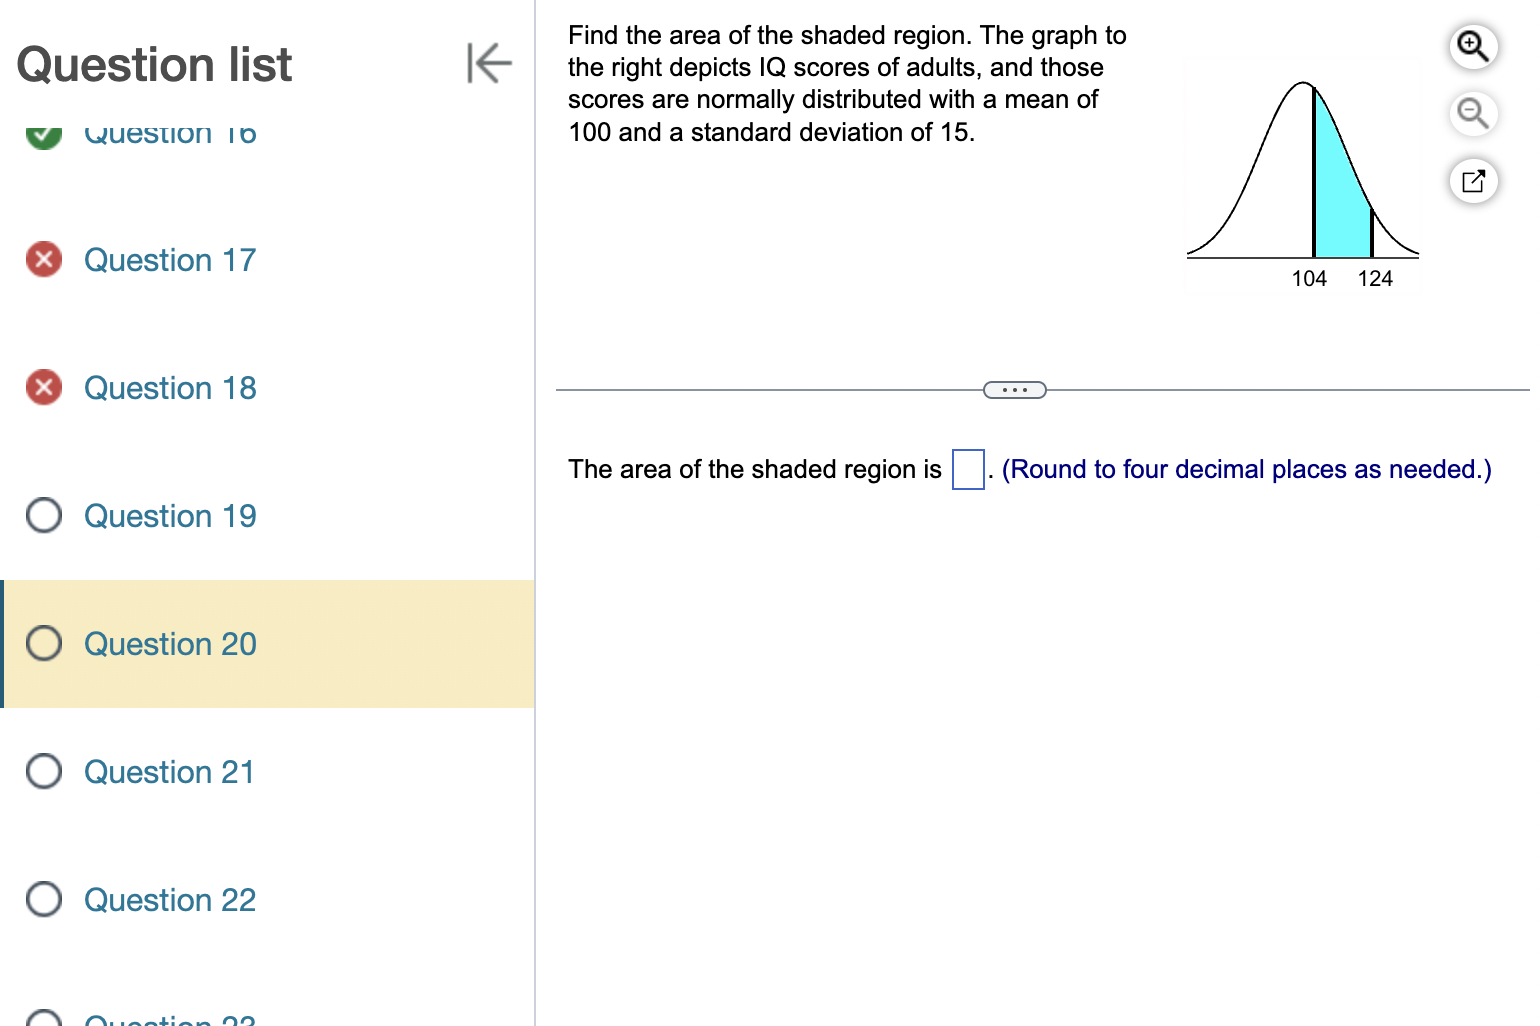
Question
1 Approved Answer
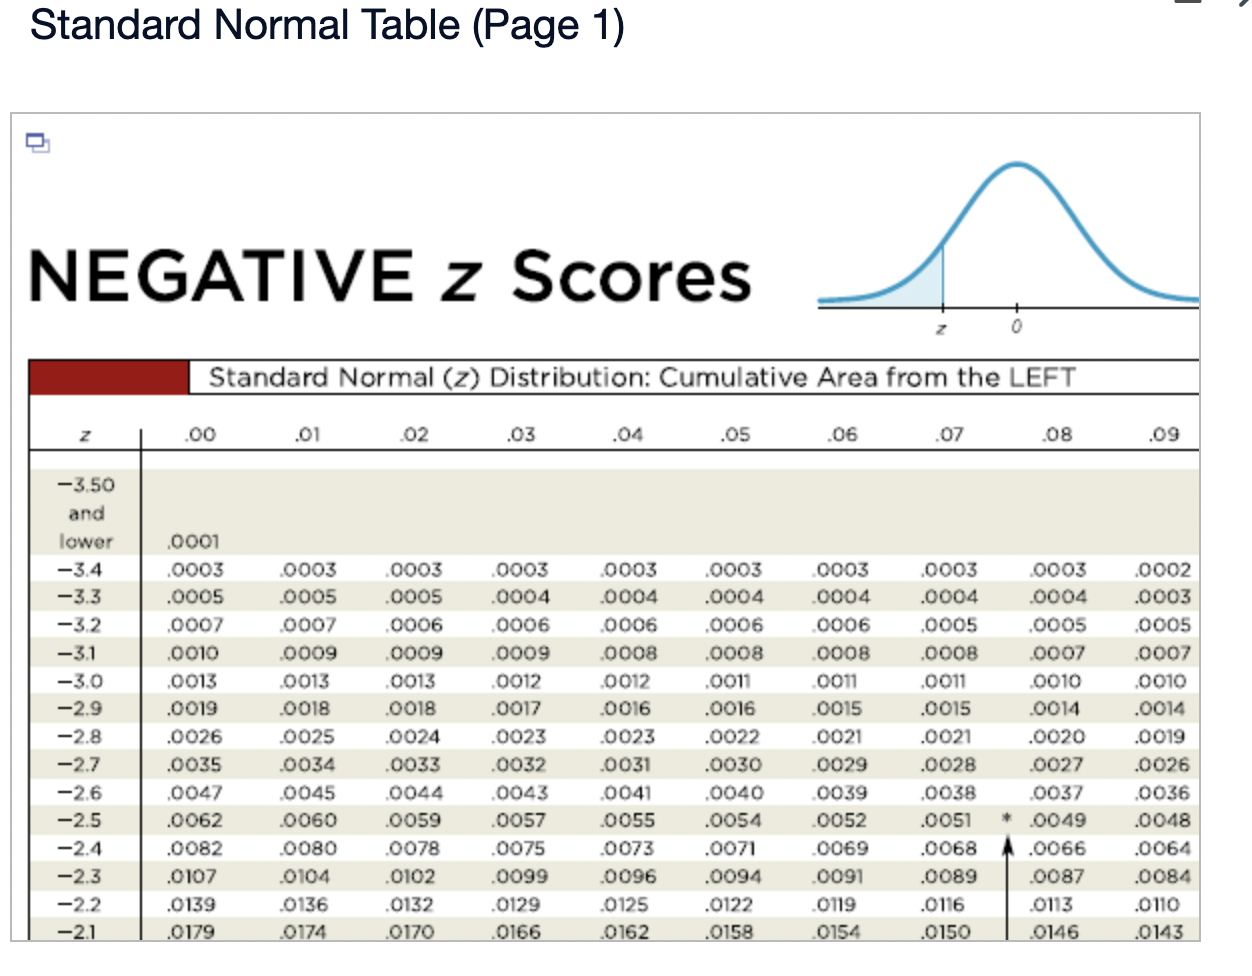
Standard Normal Table (Page 1) NEGATIVE 2 Scores Standard Normal (2) Distribution: Cumulative Area from the LEFT 3.50 and lower 3 4 ~13 $ 2


Step by Step Solution
There are 3 Steps involved in it
Step: 1

Get Instant Access to Expert-Tailored Solutions
See step-by-step solutions with expert insights and AI powered tools for academic success
Step: 2

Step: 3
Ace Your Homework with AI
Get the answers you need in no time with our AI-driven, step-by-step assistance
Get Started
Algebra And Trigonometry
Authors: Ron Larson
9th Edition
1285605705, 9781285605708