

Question
Required a). Consider using a simple moving average model. Experiment with models using five weeks and three weeks past data. (Round your answers to 2
Required
a). Consider using a simple moving average model. Experiment with models using five weeks and three weeks past data. (Round your answers to 2 decimal places.)rn
b). Evaluate the forecasts that would have been made over the 13 weeks using the overall (at the end of the 13 weeks) mean absolute deviation, mean absolute percent error, and tracking signal as criteria.(Negative values should be indicated by a minus sign. Enter "MAPE" answers in percentage rounded to 2 decimal places. Round your answers to 2 decimal places.)rn
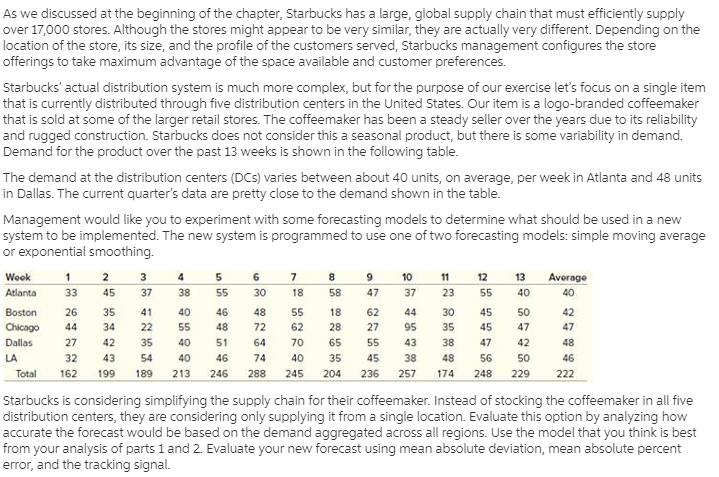
As we discussed at the beginning of the chapter, Starbucks has a large, global supply chain that must efficiently supply over 17,000 stores. Although the stores might appear to be very similar, they are actually very different. Depending on the location of the store, its size, and the profile of the customers served, Starbucks management configures the store offerings to take maximum advantage of the space available and customer preferences. Starbucks' actual distribution system is much more complex, but for the purpose of our exercise let's focus on a single item that is currently distributed through five distribution centers in the United States. Our item is a logo-branded coffeemaker that is sold at some of the larger retail stores. The coffeemaker has been a steady seller over the years due to its reliability and rugged construction. Starbucks does not consider this a seasonal product, but there is some variability in demand. Demand for the product over the past 13 weeks is shown in the following table. The demand at the distribution centers (DCs) varies between about 40 units, on average, per week in Atlanta and 48 units in Dallas. The current quarter's data are pretty close to the demand shown in the table. Management would like you to experiment with some forecasting models to determine what should be used in a new system to be implemented. The new system is programmed to use one of two forecasting models: simple moving average or exponential smoothing. Wook 3 4 5 6. 7 8 9 10 11 12 13 Average Atlanta 33 45 37 38 55 30 18 58 47 37 23 55 40 40 Boston 26 35 41 40 46 48 55 18 62 44 30 45 50 42 Chicago 44 34 22 55 48 72 62 28 27 95 35 45 47 47 Dallas 27 42 35 40 51 64 70 65 55 43 38 47 42 48 LA 32 43 54 40 46 74 40 35 45 38 48 56 50 46 Total 162 199 189 213 246 288 245 204 236 257 174 248 229 222 Starbucks is considering simplifying the supply chain for their coffeemaker. Instead of stocking the coffeemaker in all five distribution centers, they are considering only supplying it from a single location. Evaluate this option by analyzing how accurate the forecast would be based on the demand aggregated across all regions. Use the model that you think is best from your analysis of parts 1 and 2. Evaluate your new forecast using mean absolute deviation, mean absolute percent error, and the tracking signal.
Step by Step Solution
3.39 Rating (161 Votes )
There are 3 Steps involved in it
Step: 1

Get Instant Access to Expert-Tailored Solutions
See step-by-step solutions with expert insights and AI powered tools for academic success
Step: 2

Step: 3
Ace Your Homework with AI
Get the answers you need in no time with our AI-driven, step-by-step assistance
Get Started
Statistics Data Analysis And Decision Modeling
Authors: James R. Evans
5th Edition
132744287, 978-0132744287