

Answered step by step
Verified Expert Solution
Question
1 Approved Answer
Start Excel. Open the downloaded file named Excel_CH13_PS1_Metrics.xlsx . Grader has automatically added your last name to the beginning of the filename. Save the file
| Start Excel. Open the downloaded file named Excel_CH13_PS1_Metrics.xlsx. Grader has automatically added your last name to the beginning of the filename. Save the file to the location where you are storing your files. | 0 |
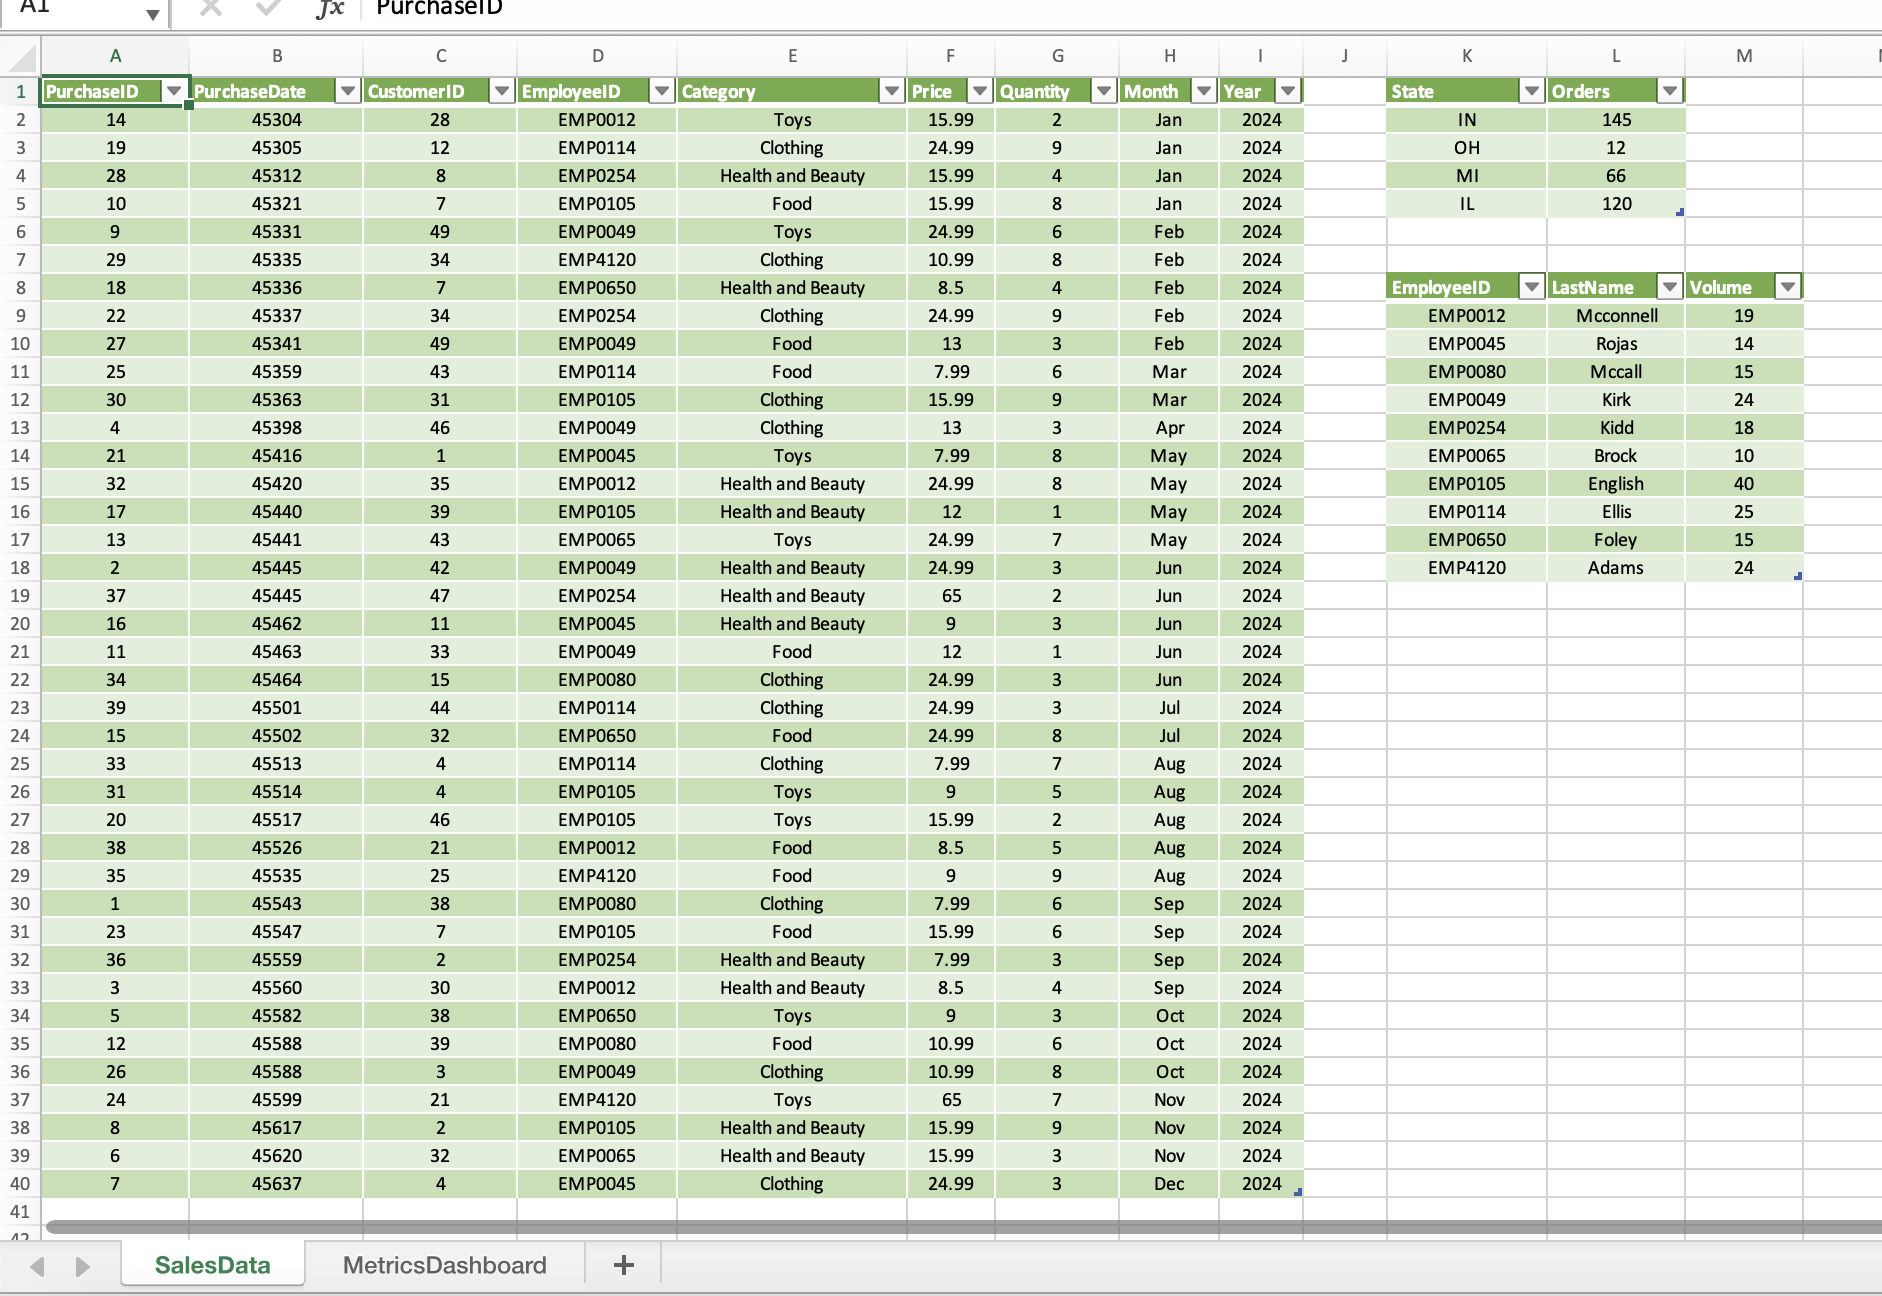
| 2 | On the SalesData worksheet, use the Geography Data Type to view the corresponding Population for each of the states listed in the table. |
| 3 | To build an interactive dashboard from multiple tables, each table must first be added to the data model. On the SalesData worksheet tab, add each of the tables to the data model. |
| 4 | Edit the data model by completing the following tasks on the SalesData worksheet: Format the PurchaseDate field as *3/14/2012 Format the Price field as Currency |
| 5 | On the SalesData2024 Power Pivot tab, create a calculated column to the right of Year with the name Revenue. Use the formula =[Price]*[Quantity] to calculate the revenue generated from each sale. Format the column as Currency, $ English (United States). |
Could you please provide a detailed step-by-step walk through of each step and where to go exactly to complete each step. Thank you!
SalesData MetricsDashboardStep by Step Solution
There are 3 Steps involved in it
Step: 1

Get Instant Access to Expert-Tailored Solutions
See step-by-step solutions with expert insights and AI powered tools for academic success
Step: 2

Step: 3
Ace Your Homework with AI
Get the answers you need in no time with our AI-driven, step-by-step assistance
Get Started
Quantitative Methods For Business
Authors: David Anderson, Dennis Sweeney, Thomas Williams, Jeffrey Cam
11th Edition
978-0324651812, 324651813, 978-0324651751