Answered step by step
Verified Expert Solution
Question
1 Approved Answer
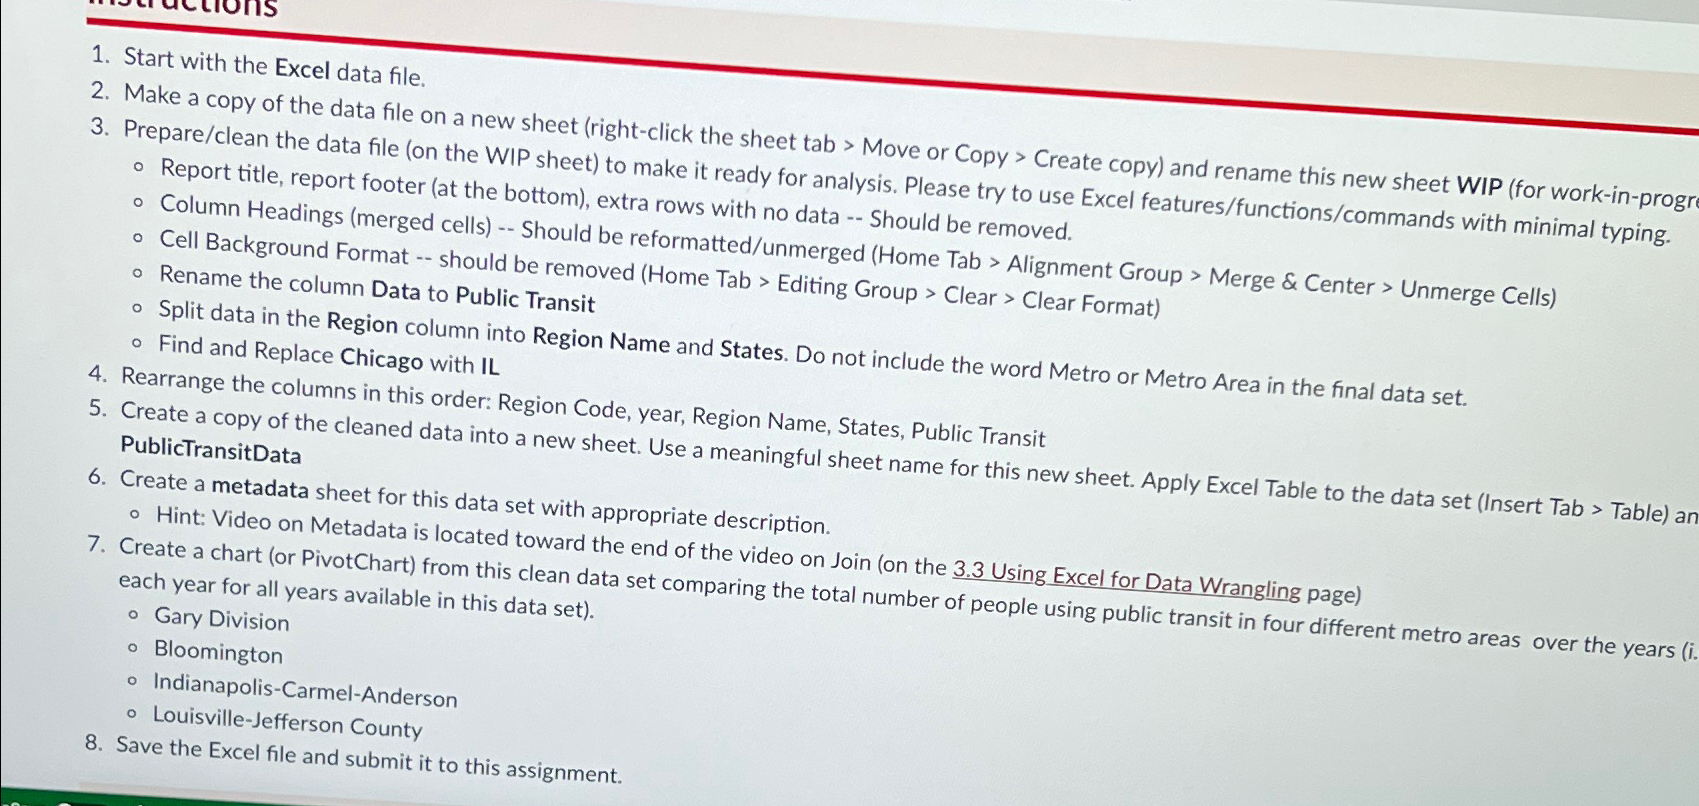
Start with the Excel data file. Make a copy of the data file on a new sheet ( right - click the sheet tab >
Start with the Excel data file.
Make a copy of the data file on a new sheet rightclick the sheet tab Move or Copy Create copy and rename this new sheet WIP for workinprogr
Prepareclean the data file on the WIP sheet to make it ready for analysis. Please try to use Excel featuresfunctionscommands with minimal typing.
Report title, report footer at the bottom extra rows with no data Should be removed.
Cell Background Format merged cells Should be reformattedunmerged Home Tab Alignment Group Merge & Center Unmerge Cells
Rename the column Background Format should be removed Home Tab Editing Group Clear Clear Format
Rename the column Data to Public Transit
Split data in the Region column into Region Name and States. Do not include the word Metro or Metro Area in the final data set.
Find and Replace Chicago with IL
Rearrange the columns in this order: Region Code, year, Region Name, States, Public Transit
Create a copy of the cleaned data into a new sheet. Use a meaningful sheet name for this new sheet. Apply Excel Table to the data set Insert Tab Table an PublictransitData
Create a metadata sheet for this data set with appropriate description.
Hint: Video on Metadata is located toward the end of the video on Join on the Using Excel for Data Wrangling page
Create a chart or PivotChart from this clean data set comparing the total number of people using public transit in four different metro areas over the years each year for all y Gary Division Bloomington
IndianapolisCarmelAnderson
LouisvilleJefferson County
Save the Excel file and submit it to this assignment.

Step by Step Solution
There are 3 Steps involved in it
Step: 1

Get Instant Access to Expert-Tailored Solutions
See step-by-step solutions with expert insights and AI powered tools for academic success
Step: 2

Step: 3

Ace Your Homework with AI
Get the answers you need in no time with our AI-driven, step-by-step assistance
Get Started


