

Answered step by step
Verified Expert Solution
Question
1 Approved Answer
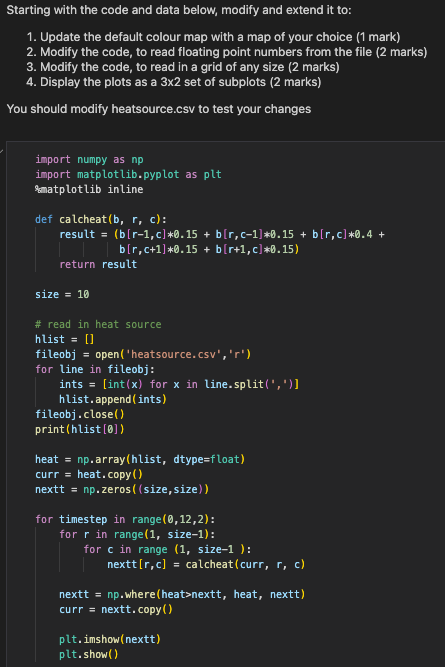
Starting with the code and data below, modify and extend it to: 1. Update the default colour map with a map of your choice (1

Step by Step Solution
There are 3 Steps involved in it
Step: 1

Get Instant Access to Expert-Tailored Solutions
See step-by-step solutions with expert insights and AI powered tools for academic success
Step: 2

Step: 3
Ace Your Homework with AI
Get the answers you need in no time with our AI-driven, step-by-step assistance
Get Started
Introductory Relational Database Design For Business With Microsoft Access
Authors: Jonathan Eckstein, Bonnie R. Schultz
1st Edition
1119329418, 978-1119329411