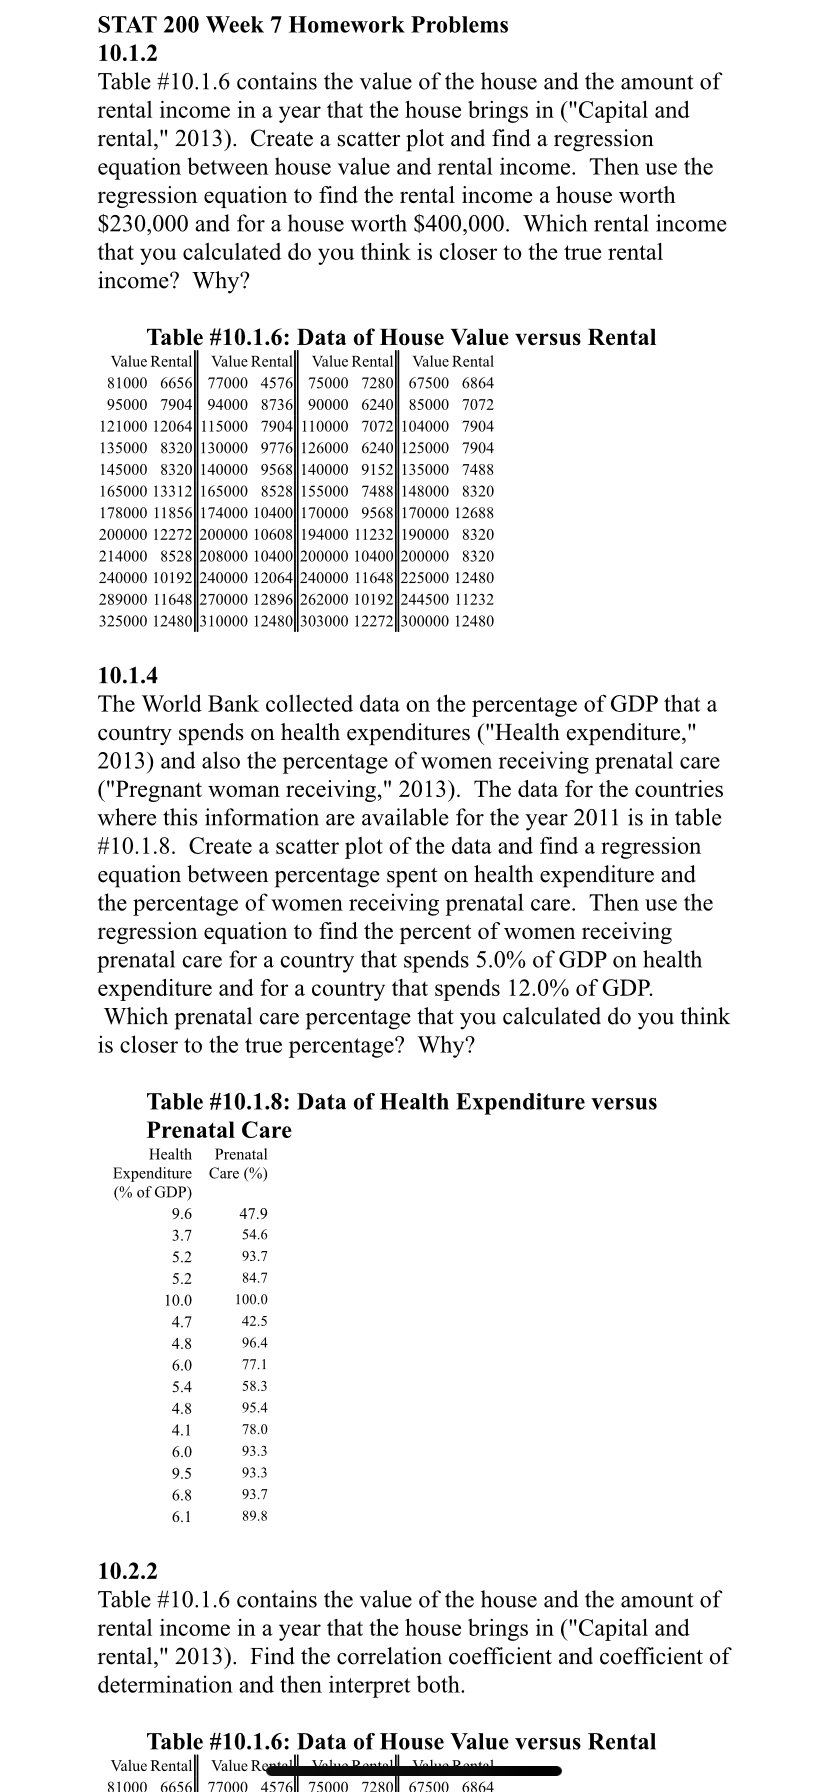
STAT 200 Week 7 Homework Problems 10. 1 . 2 Table # 10. 1 . 6 contains the value of the house and the amount of rental income in a year that the house brings in ( " Capital and rental , " 2013 ) . Create a scatter plot and find a regression equation between house value and rental income . Then use the regression equation to find the rental income a house worth $230, 000 and for a house worth $400, 000 . Which rental income that you calculated do you think is closer to the true rental income ? Why ? Table # 10. 1. 6: Data of House Value versus Rental Value Rental Value Rental\\ Value Rentall Value Rental 81000 6656 77000 4576| 750.00 7280| { 67500 6864 950,00 7904| 940.00 8736| 90,000 6240| 850.00 7072 121000 12064| 1 150.00 7904|110000 7072\\104000 7904 1350,00 8320| 130,000 9776| 126000 6240| 125000 7904 145000 8320| 1400.00 9568|140.000 9152| 135000 7488 1650.00 13.312| 1650.00 8528|1550.00 7488| 148000 8320 1780.00 1 1856\\1740,00 10400| 170,000 9568\\170,000 12688 20,0000 12272| 200000 10608| 1940,00 1 1232| 190.000 8320 214000 8528\\ 2080,00 10400| 200000 10400| 200000 8320 240.000 10192\\ 240,000 12064\\240.000 1 1648\\ 2250,00 12480 2890.00 1 1648\\2700,00 12896\\ 262000 10192\\ 24 4500 1 1232 3250.00 12480|310000 12480|303.000 12272\\300.000 12480 10. 1 . 4 The World Bank collected data on the percentage of GDP that a country spends on health expenditures ( " Health expenditure , " 2013 ) and also the percentage of women receiving prenatal care (" Pregnant woman receiving , " 2013 ) . The data for the countries where this information are available for the year 201 1 is in table # 10. 1. 8. Create a scatter plot of the data and find a regression equation between percentage spent on health expenditure and the percentage of women receiving prenatal care . Then use the* regression equation to find the percent of women receiving* prenatal care for a country that spends 5. 0% of GDP on health expenditure and for a country that spends 12. 0% of GDP . Which prenatal care percentage that you calculated do you think is closer to the true percentage ? Why ?! Table # 10. 1. 8: Data of Health Expenditure versus Prenatal Care Health Prenatal Expenditure* Care (`/0 ) ( % of GDP ) 9.6 47. 9 3. 7 54.6 5.2 93. 7 5 .2 84 .7 10.0 100.0 4 . 7 42.5 4.8 96. 4 6.0 77. 1 5.4 58.3 4.8 95.4 4 .1 78.0 6.0 93.3 9.5 93. 3 6.8 93 . 7 6 .1 89.8 10. 2. 2 Table $ 10. 1. 6 contains the value of the house and the amount of rental income in a year that the house brings in ( " Capital and rental , " 2013 ) . Find the correlation coefficient and coefficient of* determination and then interpret both . Table # 10. 1. 6 : Data of House Value versus Rental Value Rental\\ Value Rentall!` 1576\\


