Answered step by step
Verified Expert Solution
Question
1 Approved Answer
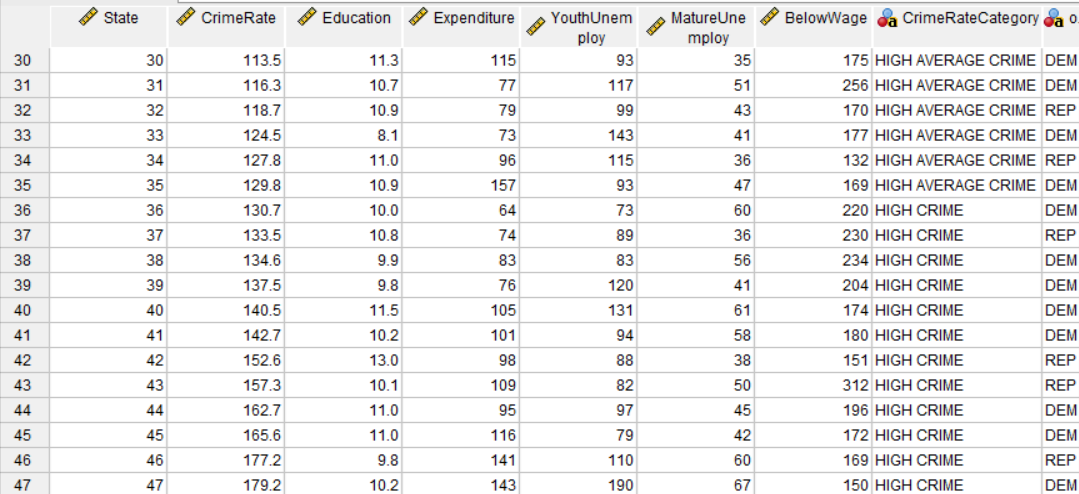
State CrimeRate Education Expenditure YouthUnem MatureUne BelowWage da CrimeRateCategory da O ploy mploy 26.5 11.1 75 80 21 2 123 LOW CRIME 36.9 DEM 12.9
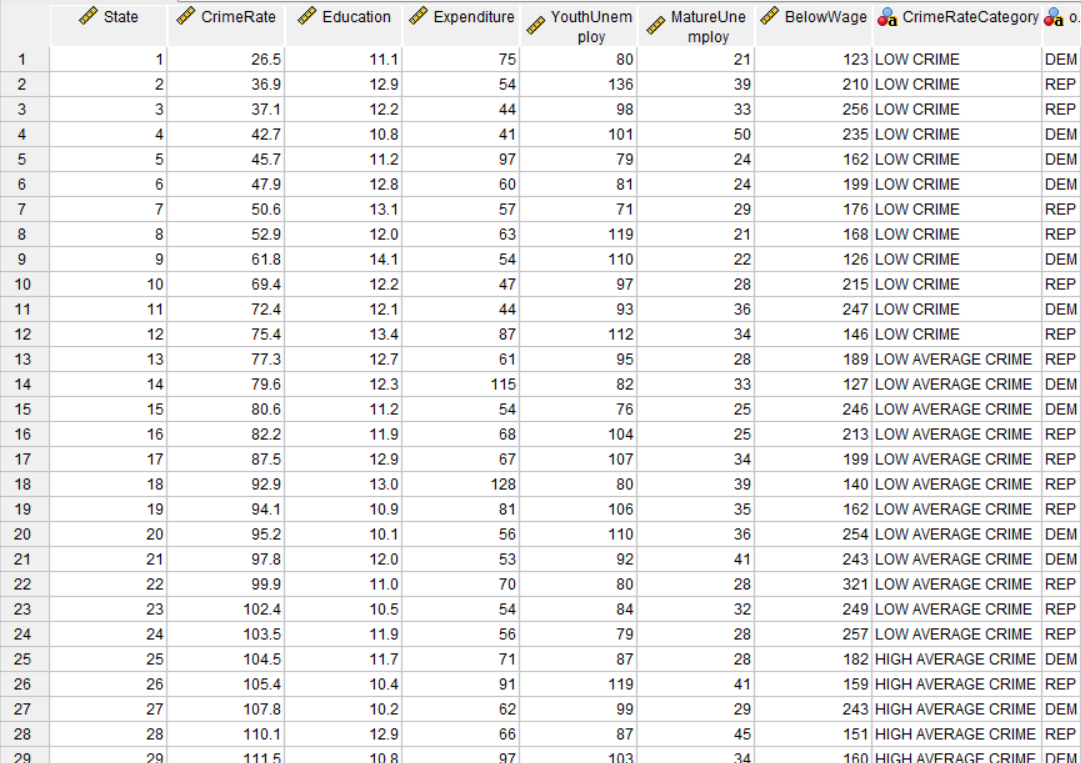
State CrimeRate Education Expenditure YouthUnem MatureUne BelowWage da CrimeRateCategory da O ploy mploy 26.5 11.1 75 80 21 2 123 LOW CRIME 36.9 DEM 12.9 W N 54 136 39 210 LOW CRIME REP W 37.1 12.2 44 98 33 256 LOW CRIME 4 42.7 REP 10.8 41 101 50 5 235 LOW CRIME 45.7 11.2 DEM 97 79 24 162 LOW CRIME 6 47.9 DEM 12.8 60 81 24 7 199 LOW CRIME 50.6 DEM 13.1 57 71 29 176 LOW CRIME 8 52.9 REF 12.0 (D CO 63 119 21 9 168 LOW CRIME 61.8 REP 14.1 54 110 22 10 10 126 LOW CRIME 69.4 DEM 12.2 47 97 28 11 11 215 LOW CRIME 72.4 REP 12.1 44 93 36 12 12 75.4 247 LOW CRIME 13.4 DEM 87 112 34 13 146 LOW CRIME 13 77.3 REP 12.7 61 95 28 14 14 79.6 189 LOW AVERAGE CRIME REP 12.3 115 82 33 15 15 80.6 127 LOW AVERAGE CRIME DEM 11.2 54 76 25 16 16 246 LOW AVERAGE CRIME DEM 82.2 11.9 68 104 25 17 17 213 LOW AVERAGE CRIME REP 87.5 12.9 67 107 34 18 18 199 LOW AVERAGE CRIME REP 92.9 13.0 128 80 39 19 19 94.1 140 LOW AVERAGE CRIME REP 10.9 81 106 35 20 20 95.2 162 LOW AVERAGE CRIME REP 10.1 56 110 36 21 21 97.8 254 LOW AVERAGE CRIME DEM 12.0 53 92 41 22 22 99.9 243 LOW AVERAGE CRIME DEM 11.0 70 80 28 23 23 102.4 321 LOW AVERAGE CRIME REP 10.5 54 84 32 24 24 103.5 249 LOW AVERAGE CRIME REP 11.9 56 79 28 25 25 257 LOW AVERAGE CRIME REP 104.5 11.7 71 87 28 26 26 105.4 182 HIGH AVERAGE CRIME DEM 10.4 91 119 41 27 27 159 HIGH AVERAGE CRIME REP 107.8 10.2 62 99 29 28 28 110.1 243 HIGH AVERAGE CRIME DEM 12.9 66 87 45 1115 151 HIGH AVERAGE CRIME REP 108 97 103 24 160 HIGH AVERAGEState CrimeRate Education Expenditure YouthUnem MatureUne BelowWage da CrimeRateCategory da 0 ploy mploy 30 30 113.5 11.3 115 93 35 175 HIGH AVERAGE CRIME DEM 31 31 116.3 10.7 77 117 51 256 HIGH AVERAGE CRIME DEM 32 32 118.7 10.9 79 99 43 170 HIGH AVERAGE CRIME REP 33 33 124.5 8.1 73 143 41 177 HIGH AVERAGE CRIME DEM 34 34 127.8 11.0 96 115 36 132 HIGH AVERAGE CRIME REP 35 35 129.8 10.9 157 93 47 169 HIGH AVERAGE CRIME DEM 36 36 130.7 10.0 64 73 60 220 HIGH CRIME DEM 37 37 133.5 10.8 74 89 36 230 HIGH CRIME REP 38 38 134.6 9.9 83 83 56 234 HIGH CRIME DEM 39 39 137.5 9.8 76 120 41 204 HIGH CRIME DEM 40 40 140.5 11.5 105 131 61 174 HIGH CRIME DEM 41 41 142.7 10.2 101 94 58 180 HIGH CRIME DEM 42 42 152.6 13.0 98 88 38 151 HIGH CRIME REP 43 43 157.3 10.1 109 82 50 312 HIGH CRIME REP 44 44 162.7 11.0 95 97 45 196 HIGH CRIME DEM 45 45 165.6 11.0 116 79 42 172 HIGH CRIME DEM 46 46 177.2 9.8 141 110 60 169 HIGH CRIME REP 47 47 179.2 10.2 143 190 67 150 HIGH CRIME DEMName Type Width Decimals Label Values Missing Columns Align Measure State Numeric 3 10 None None 12 Right Scale CrimeRate Numeric Number of offences per million people None None 12 Right Scale In W N Education Numeric 1 Average number of years of schooling None None 12 Right Scale In AA Expenditure Numeric 0 Police expenditure per capita on police (in thousands) None None 12 Right In OUI A YouthUnem... Numeric Number of males unemployed aged 18-24 per 1000 None None 12 Right Scale In MatureUne.. Numeric 0 Number of males unemployed aged 25-39 per 1000 None None 12 Right Scale In AWA BelowWage Numeric Poverty rate; Number of families below half the average wage per 1000 None None 12 Right Scale In 8 CrimeRate... String 18 Classification of crime by crime rate None None 18 Left Nominal In Dominant Political Party: The majority of the populace in the state voted for the specified party in all major elections over the past 2 years. None None 3 DomPolit String Left Nominal
Step by Step Solution
There are 3 Steps involved in it
Step: 1
Get Instant Access to Expert-Tailored Solutions
See step-by-step solutions with expert insights and AI powered tools for academic success
Step: 2
Step: 3
Ace Your Homework with AI
Get the answers you need in no time with our AI-driven, step-by-step assistance
Get Started