

Question: State if the following statements are true or false by reporting ``T'' (for ``true'') or ``F'' (for ``false'') in the parentheses after the end of
State if the following statements are true or false by reporting ``T'' (for ``true'') or ``F'' (for ``false'') in the parentheses after the end of the sentence.
1. If the expected value of sample information exceeds the cost of getting the sample information, then it is worth paying for the sample information according to decision theory.
2. Sensitivity analysis in decision theory analyzes the sensitivity of decisions to probabilities and utilities.
3. Some decisions are better than others irrespective of probabilities.
4. A decision-theoretic expert system may not have rules that traditional knowledge-based systems have.
5. Sensitivity analysis is not at all important in the development of decision-theoretic expert systems.
6. A non-deterministic action is an action whose outcome is uncertain.
7. The best decision for an agent can always be found using just the payoff table.
8. Utilities are always nonnegative.
9. Finding the expected value of perfect information allows us to decide if it is worth paying for perfect information.
10. Expected utilities are always positive.
11. Multiple nodes in a decision tree in decision theory may contain the same decision variable.
12. A decision tree with n decision variables and m chance variables has n * m nodes.
13. Multiple nodes in a decision tree in decision theory may contain the same chance variable.
14. An optimal policy specifies one decision to be used in all circumstances.
15. The order in which chance variables and decision variables appear along a path in a decision tree does not matter.
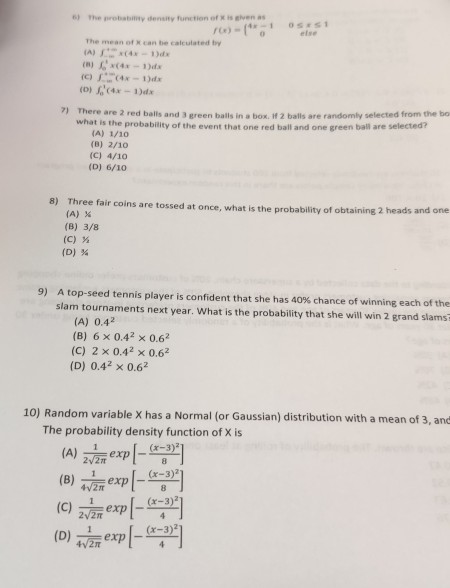
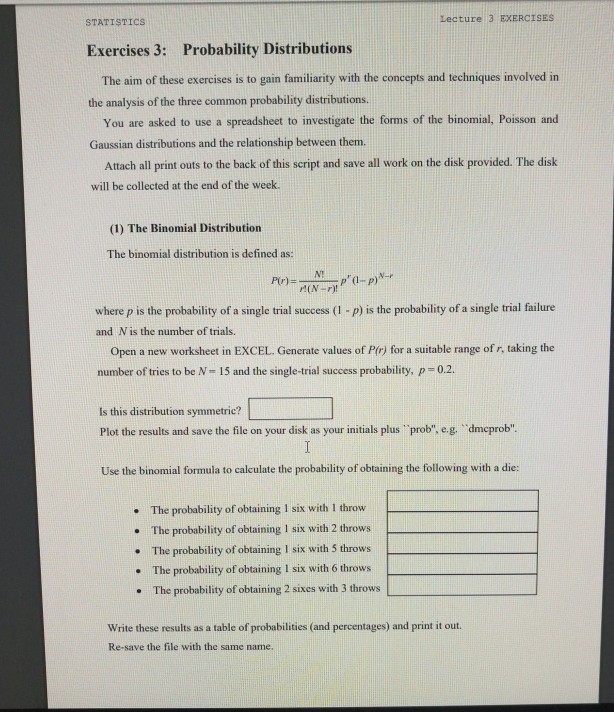
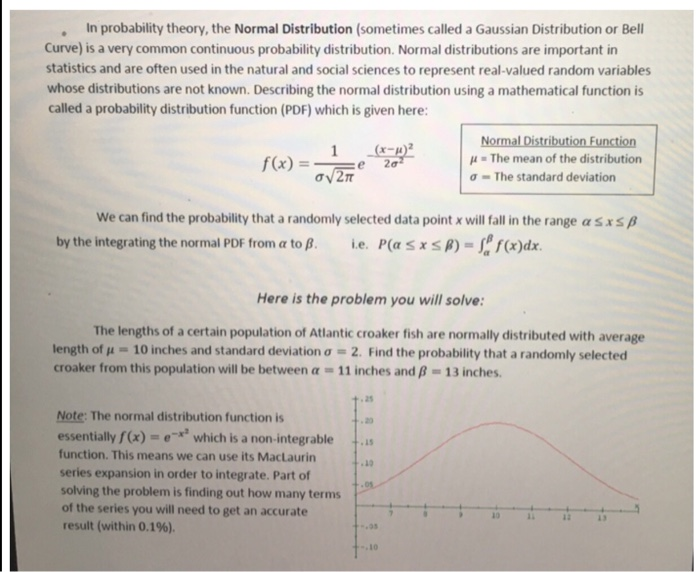
" The probability dentity fur tion of A is given as The mean of A can be calculated bry 7) There are 2 red balls and 3 green bails in a box. If 2 balls are randomly selected from the bo what is the probability of the event that one red ball and one green ball are selected? [A) 1/10 (8) 2/10 (C) 4/10 (D) 6/10 8) Three fair coins are tossed at once, what is the probability of obtaining 2 heads and one (A) X (B) 3/B (C) X (D) % 9) A top-seed tennis player is confident that she has 40%% chance of winning each of the slam tournaments next year. What is the probability that she will win 2 grand slams (A) 0,42 (B) 6 x 0,42 x 0.62 (C) 2 x 0.42 x 0.62 (D) 0.42 x 0.62 10) Random variable X has a Normal (or Gaussian) distribution with a mean of 3, and The probability density function of X is (A) ; =exp (x-3) 2V/27 1 (B) =exp (x-3)2 1 (x-3)2 (C) exp 2V/2n 1 (x-3)2] (D) V2n =expSTATISTICS Lecture ] EXERCISES Exercises 3: Probability Distributions The aim of these exercises is to gain familiarity with the concepts and techniques involved in the analysis of the three common probability distributions. You are asked to use a spreadsheet to investigate the forms of the binomial, Poisson and Gaussian distributions and the relationship between them. Attach all print outs to the back of this script and save all work on the disk provided. The disk will be collected at the end of the week. (1) The Binomial Distribution The binomial distribution is defined as: P(r)= NI p (1-p)- where p is the probability of a single trial success (1 - p) is the probability of a single trial failure and N is the number of trials. Open a new worksheet in EXCEL. Generate values of P(r) for a suitable range of r. taking the number of tries to be N= 15 and the single-trial success probability, p =0.2. Is this distribution symmetric? Plot the results and save the file on your disk as your initials plus "prob". e.g. "'dmeprob". I Use the binomial formula to calculate the probability of obtaining the following with a dic: The probability of obtaining I six with I throw . The probability of obtaining I six with 2 throws The probability of obtaining I six with 5 throws The probability of obtaining 1 six with 6 throws The probability of obtaining 2 sixes with 3 throws Write these results as a table of probabilities (and percentages) and print it out. Re-save the file with the same name.In probability theory, the Normal Distribution (sometimes called a Gaussian Distribution or Bell Curve) is a very common continuous probability distribution. Normal distributions are important in statistics and are often used in the natural and social sciences to represent real-valued random variables whose distributions are not known. Describing the normal distribution using a mathematical function is called a probability distribution function (PDF) which is given here: 1 (x-1)2 Normal Distribution Function f (x) = e # = The mean of the distribution aV2n - The standard deviation We can find the probability that a randomly selected data point x will fall in the range a Sx 5 B by the integrating the normal PDF from a to B. i.e. P(a s x SB) = [" f(x)dx. Here is the problem you will solve: The lengths of a certain population of Atlantic croaker fish are normally distributed with average length of # = 10 inches and standard deviation o = 2. Find the probability that a randomly selected croaker from this population will be between a = 11 inches and S = 13 inches. Note: The normal distribution function is . 20 essentially /(x) = e"* which is a non-integrable . 15 function. This means we can use its MacLaurin series expansion in order to integrate. Part of - 09 solving the problem is finding out how many terms of the series you will need to get an accurate result (within 0.1%)
Step by Step Solution
There are 3 Steps involved in it

Get step-by-step solutions from verified subject matter experts